Henry. D. Valdez, BS EE;
Independent Design Analyses, Inc.; Houston, Texas
Keywords: Sneak Analysis (HW / SW SA),
Fault Tree Analysis (FTA), Failure Modes and Effects Analysis (FMEA),
Criticality Analysis, Network Trees
Abstract
The primary function of Sneak Analysis is the detection of unexpected modes of operation in hardware and software systems. These unplanned modes of operation are not failureinitiated and are called sneak conditions. These conditions are characterized by their random nature and ability to escape detection during the most rigorous of standardized system tests. Sneak conditions can cause improper operation, loss of system availability, program delays, or even death or injury to personnel.
Regardless of the development methodology or design phase, sneak conditions have been uncovered. The benefits of improved safety, reliability, and reduced life cycle costs gained from a properly executed Sneak Analysis have been demonstrated time after time. Sneak Analysis has helped reduce schedule risks and costs by detecting hardware and software errors before test or occurrence of the condition, by recommending corrections to the design, by reducing retest situations, and by reducing maintenance and logistics costs.
This paper will explain the state of the Integrated Hardware/Software Sneak Analysis technique from the development of the Baseline Analysis Tools to clue application and through the completion of the integrated analysis phase. Also, the advantages of integrating Sneak Analysis with other design and safety analyses will be discussed, such as an integrated Hardware/Software Fault Tree Analysis (FTA), and a Hardware/Software Failure Modes, Effects and Criticality Analysis (FMECA).
Introduction
The Sneak Analysis provides an examination of the non-failure domain of the system’s hardware and software under analysis. This paper will be separated into five sections which includes some sneak analysis background information, the Integrated Hardware/Software Sneak Analysis Approach (which includes the development of the Baseline Analysis Tools), the integration of HW/SW SA with FTA, the integration of HW/SW SA with FMECA, and conclusions.
Background
Numerous combinations of static and dynamic inputs are possible in even relatively simple circuitry. This large number of combinations becomes very difficult to evaluate or test. Avoiding the inherent shortcomings of traditional tests and simulations, Sneak Analysis does not depend upon varying inputs and then checking the outputs. Instead, Sneak Analysis in general, involves the recognition of specific topological patterns, applying sneak clues, and determining which input combination (either static or dynamic) is required for an undesirable output. This has evolved over years of Sneak Analysis development as shown in table 1.
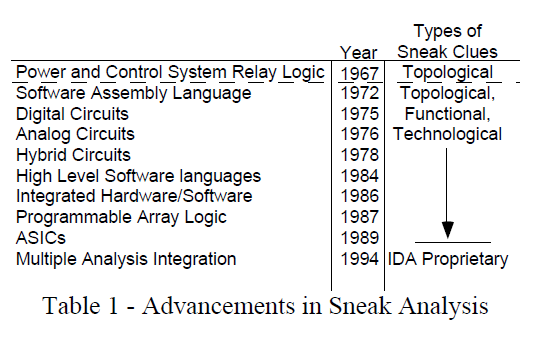
Sneak Analysis is also unique from the design process in that it uses different tools (network trees, forests, and clues) to find a specific type of problem. The network trees and forests, which are part of the Baseline Analysis Tools, are topological representations of the actual system. Each network tree represents a subfunction and shows all inputs that may affect the subfunction output. Forests are constructed by combining the network trees that contribute to a particular system output. A proper forest shows a system output in terms of all of its related inputs. These along with others become the Baseline Analysis Tools and the process is shown in figure 1.
Sneak Analysis is also unique from the design process in that it uses different tools (network trees, forests, and clues) to find a specific type of problem. The network trees and forests, which are part of the Baseline Analysis Tools, are topological representations of the actual system. Each network tree represents a subfunction and shows all inputs that may affect the subfunction output. Forests are constructed by combining the network trees that contribute to a particular system output. A proper forest shows a system output in terms of all of its related inputs. These along with others become the Baseline Analysis Tools and the process is shown in figure 1.
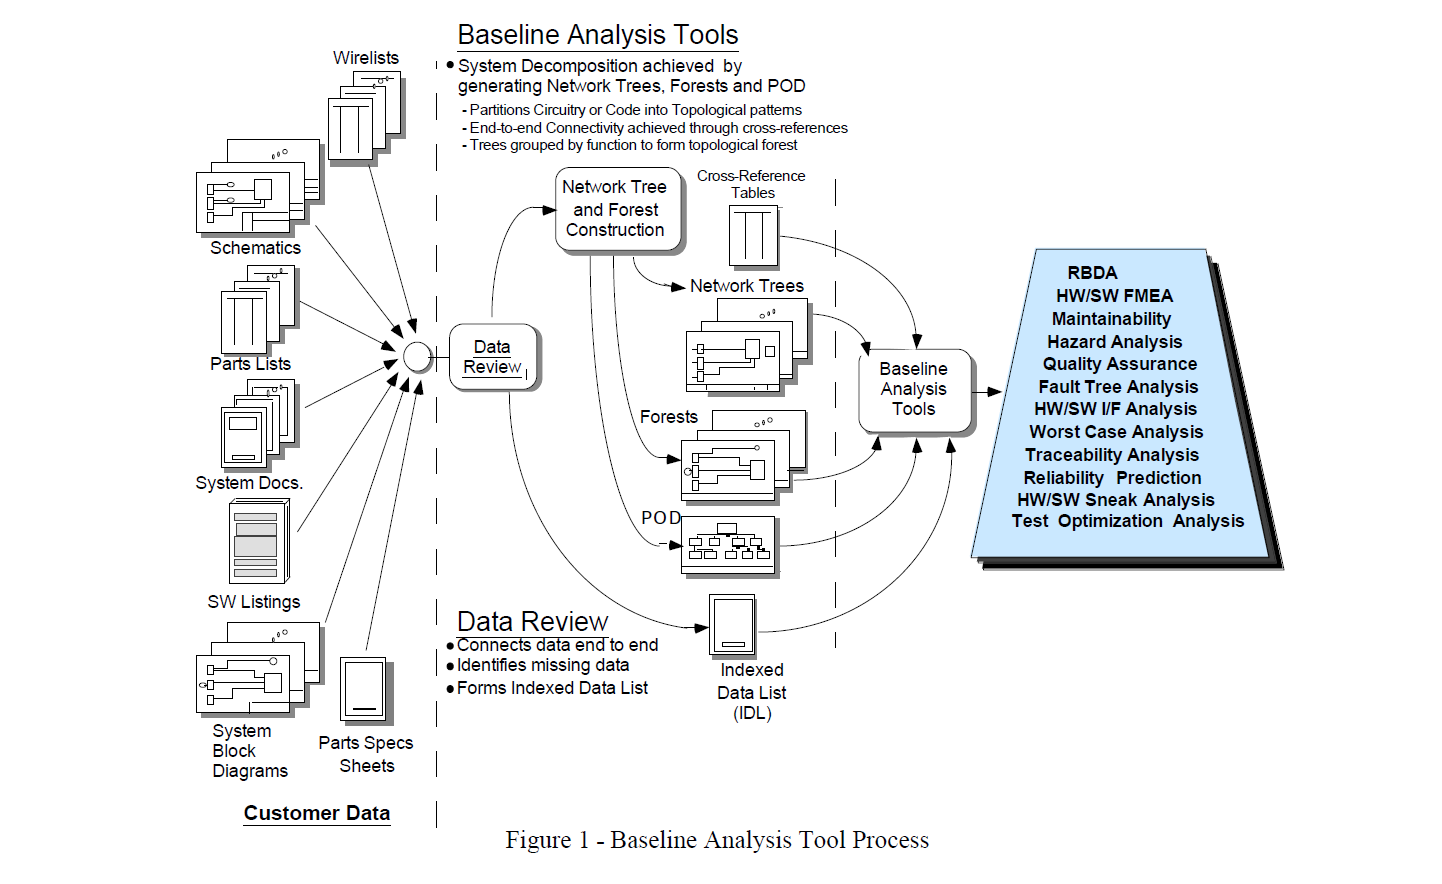
Sneak clues are visual topological, functional or technological keys identifiable on the trees and forests. If a clue applies, the combination of inputs that cause a potential sneak condition are determined. These are further investigated to validate or invalidate the potential sneak condition. By contrast, simulation and testing is unlike clue application, because they are limited to remaining within the specified procedures or mission profiles, and therefore may not reveal sneak conditions.
Integrated Hardware/Software Sneak Analysis
Sneak Analysis is performed in four phases: (1) data preparation, (2) network tree construction, (3) clue application, and (4) final report preparation. The first two phases are a major part of the creation of the Baseline Analysis Tools. Generally, reporting of Sneak Conditions and Design Concerns occur throughout the first three phases of the analysis. The overall process flow is shown in figure 2.
Data Preparation:
During this phase the hardware and software data received is compared to contractual requirements as a preliminary determination of completeness. Revision numbers are checked on all drawings and software listings to assure the analysis will be performed on the correct versions. Any discrepancies are reported to the technical interface via teleconferences. All the data is filed for easy access by the analysts, and for confirmation by the customer as means of configuration control.
Network Tree And Forest Construction:
Design data are set up for the design and manufacturing process can hide sneak conditions. Assembly drawings, Schematic and Parts Lists depicting electronic circuit cards are really intended for the manufacture of the circuit card, thus design documents hide the sneak conditions by displaying many different system functions on many styles of documents from many different vendors. Coupling these facts with the hardware/software and software/software interfaces, reveals that many sneak conditions are possible and very difficult to uncover using traditional analysis or testing techniques such as design/code inspections or "test to requirements" methodologies.
The difficulty in finding sneak conditions is also a result of the combination of events that it takes to cause the sneak condition. These events are usually not normal operating conditions and are difficult to find by testing. However, network trees and forests enable reliable detection of sneak conditions.
Hardware network trees show all the components and their connectivity. Each network tree is constructed in a topological manner: components and nodes are arranged so that current or logic flow is from top to bottom and signal or data flow is from left to right. Electronic data is very useful for decreasing the time in network tree and forest construction. The CAD net-lists and/or wire-lists are searched for all the connectivity at each node including connecting the signals between circuit cards.
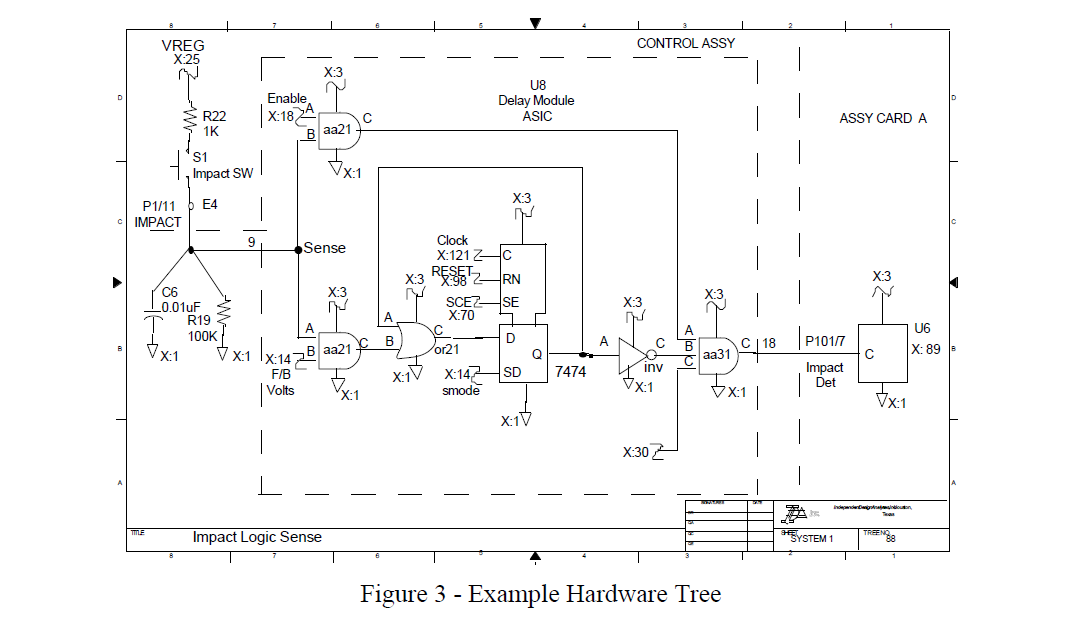
Electrical current flow and system data flow between individual network trees are maintained through cross-references. These cross-references are used to link network trees into network forests, which are described below and can also include cross-references to software trees. The cross references are maintained in an electronic database which allows all analysts to have the connectivities of all the network trees. Each network tree has a single output, and all inputs that may affect that output are shown on that network tree. An example hardware tree is shown in figure 3. It should be recognized that this network tree integrates circuitry on multiple circuit boards, internal to an ASIC, a motherboard, and several cables.
Software network trees show logic paths and instructions for a given portion of software code. Decision points and program loops are clearly shown on the network tree. An example software network tree is shown in figure 4. Each variable in the tree is cross-referenced to the network tree(s) where that variable is defined.
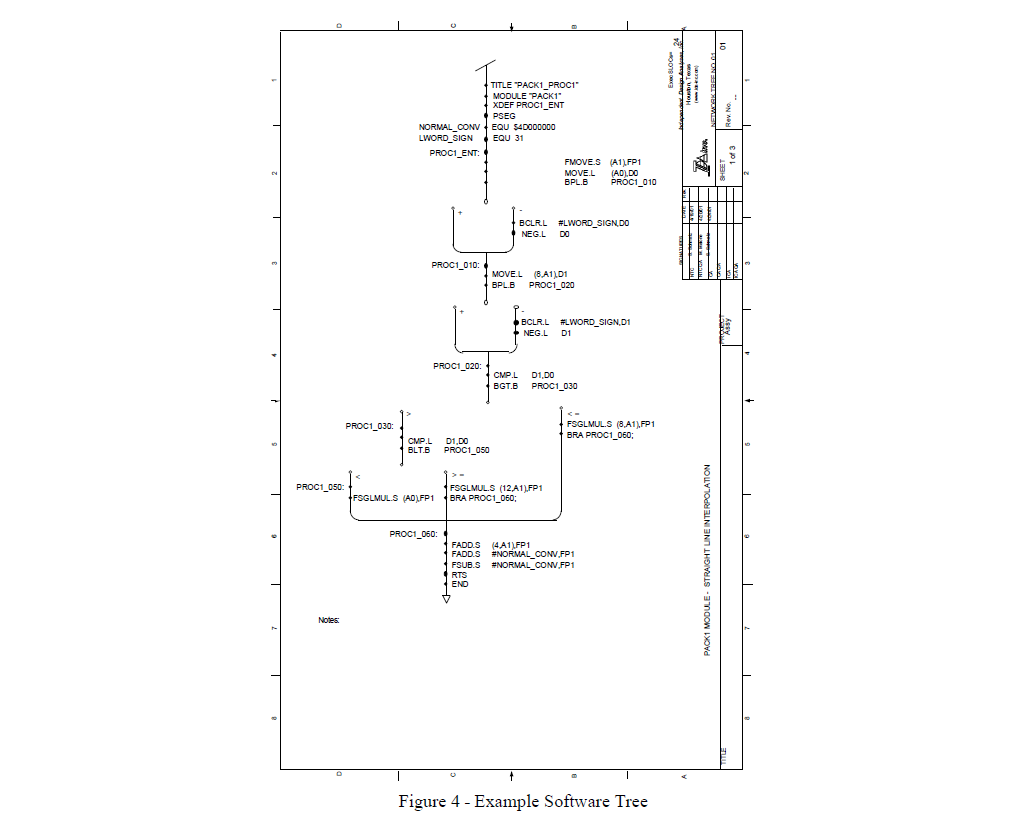
Cross-references are also maintained in an electronic database similar to the hardware, which can also cross-reference to a hardware network tree. Therefore, data flow is maintained and is traceable through the software and to its associated hardware.
Cross-references between label definitions and references, and between subroutines/modules and their calls, are included in the electronic database so that program flow can also be traced.
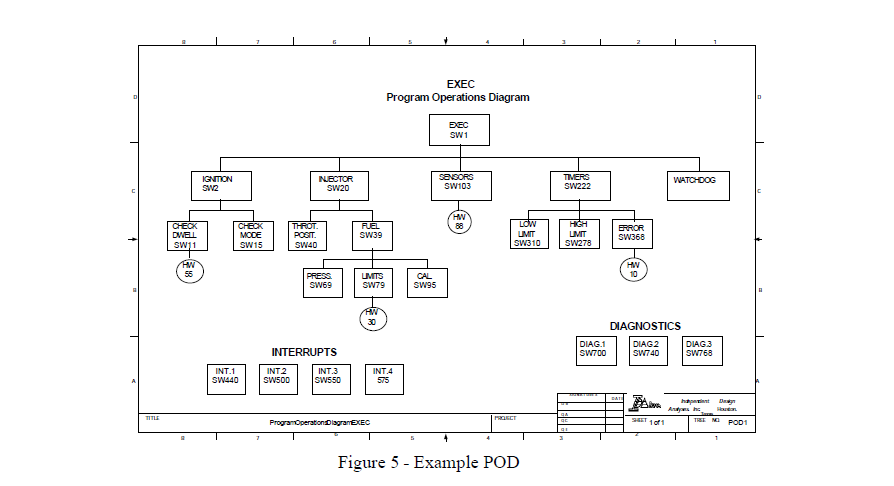
System level program flow is shown through the use of the Program Operations Diagram (POD). The POD clearly shows the interface of each software subroutine/module as well as all possible hardware/software interfaces. Critical
functions identified within a system can be highlighted on the POD and used by the analyst as a road map to assist in performing the Integrated Sneak Analysis. An example POD is shown in figure 5.
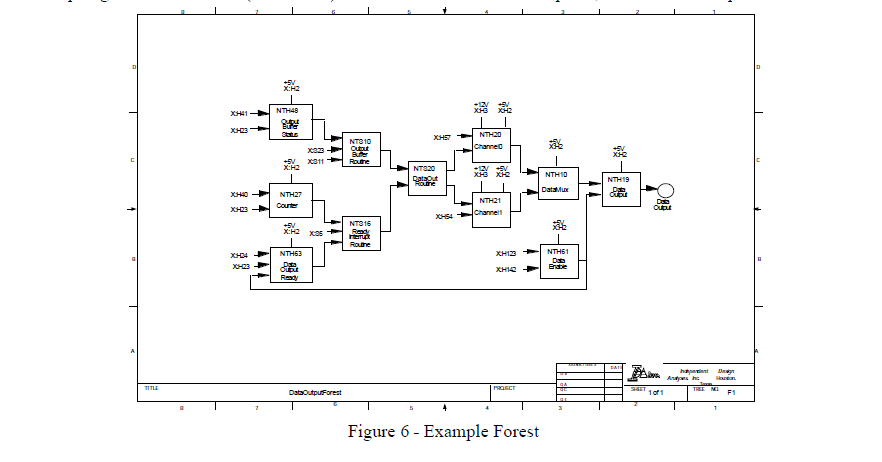
Another unique Sneak Analysis tool is a network forest. A network forest is a topological representation of a system output in terms of all of its inputs. A block is shown for each network tree and interconnecting directional lines show the input/output relationships between the network trees. As such, they provide a unique representation of a system function that cannot be seen in the hardware design data and software listings.
Forest development begins by first determining the tree number for a safety critical output. All the related network trees are identified using electronic database cross-references, and a graphical representation of their interrelationships is developed. A forest is created for each of the system’s functions. An example forest is shown in figure 6.
Clue Application:
he third phase of the analysis is the application of clues to the topological network trees (and forests). A clue is
a visual key that directs the analyst to ask a set of specific questions. The clues are subdivided into hardware, software, hardware/software, system categories which includes the topological, functional and technological types. The clues apply to both network trees and forests. These visual keys are easily identifiable on the topological network trees for the system and the questions identify which of the following sneak conditions that require further evaluation:
a. Sneak paths, which are latent paths that cause current or logic flow along an unexpected route, resulting in unwanted functions or inhibiting a desired function, not caused by component failures;
b. Sneak timing, which results from incompatible hardware or logic sequences and can cause inappropriate system response;
c. Sneak indications, which provide false or ambiguous indications of system operating status;
d. Sneak labels, which result from a lack of precise nomenclature or instructions on controls, or operating consoles that can lead to erroneous operator actions.
The analyst starts with the output of concern and evaluates one device at a time and works back to the inputs that affects that output. At each input, a specific state is determined to give the required sneak output. After all the input states are determined, a check is made of their combined states. If a sneak clue reveals that an undesirable condition may exist, then the combination of inputs required to provide the undesired condition is then determined. These input combinations could be either static, dynamic, normal and/or abnormal. If a combination is possible, then a discrepancy report is written. A report is generated regardless of the probability of a set of inputs occurring.
Reporting
There are three classes of discrepancy reports: Sneak Condition Reports (SCRs), Design Concern Reports (DCRs), and Document Discrepancy Reports (DDRs). All reports are dated, titled, and numbered for indexing and tracking. Each report contains a section at the bottom of the report form for the customer to respond with their proposed action to be taken. These responses and supporting documentation will be evaluated, and the status of the report will be updated along with the report status tracking sheets, and the affected network tree to close the quality assurance loop.
Sneak Condition Reports (SCRs): SCRs are used to document sneak conditions uncovered during the analysis. Each SCR describes the sneak condition or conditions in detail and include an illustration of the software logic where applicable. Recommendations for corrective action, as well as references to support the findings are included.
Design Concern Reports (DCRs): A DCR is prepared when undesirable conditions were identified which were not sneak conditions, but were of concern with respect to system operation, safety, reliability, testability, or maintainability. The DCRs identify potential design problems or marginal design practices. Examples of these concerns include critical single failure points, misapplication of logic, borderline timing conditions, unnecessary code, and specification non-compliance. DCRs also include those potential problems that cannot be positively identified as an SCR or DDR. These reports include illustrations of the actual hardware and/or software logic where appropriate. Recommendations for corrective action, as well as references to support the findings are also included.
DCRs have become an additional value of the Sneak Analysis but are only reported as they are discovered. The Sneak Analysis process is not specifically directed to discover these conditions since they are found more efficiently through other methods.
Document Discrepancy Reports (DDRs): DDRs are prepared for any documentation or drawing discrepancies found during the analysis. Each report identifies the document and explains the error relative to the supporting documentation referenced in the report. These reports identify documentation problems that could affect reliability, maintainability, safety, life cycle costs, or future engineering changes. The Sneak Analysis process is also not specifically directed to discover these conditions as with DCRs, however, if implemented as documented it may result in a sneak condition.
Final Report: This report is prepared at the end of the technical analysis and documents the detailed technical approach, the results of the analysis, and recommendations. All of the SCRs, DCRs, and DDRs which were generated during the analysis are included along with the. report status tracking sheets which lists all reports written along with the open/closed status of each report.
Integrated Sneak Analysis with a Hardware/Software Fault Tree Analysis (FTA)
Computer/software controlled systems can be analyzed by constructing integrated hardware/software fault trees that cover hardware through pertinent software routines and back through additional hardware. The Hardware/Software Fault Tree Analysis (FTA) is used to predict the most likely causes of a predefined undesired event. The objective of an FTA is to evaluate the possible hardware and software causes of the top-level events. The fault tree analysis uses a logical representation of hardware and software failures/faults to obtain the top-level undesired events. The logic used to obtain the top level undesired event is developed through groupings of logical gates which either permit or inhibit the failures/faults up to the top of the tree. The FTA thus produces a graphical model of various parallel and sequential failures/faults that result in the occurrence of the undesired event. The tree continues down using functional logic symbols describing the Boolean relationships between failures of basic hardware components and/or software commanded events. The fault tree is developed down to the lowest basic failure of the hardware and the software, where a software failure mode is one in which the function, for whatever reason, no longer performs the design intent.
Output reports from the analysis include identification of single and multiple failures that can cause the undesired event; the probability of the undesired event happening for any designated operation period; and a ranking of contributing single and multiple failures with their probability of being involved in the undesired event.
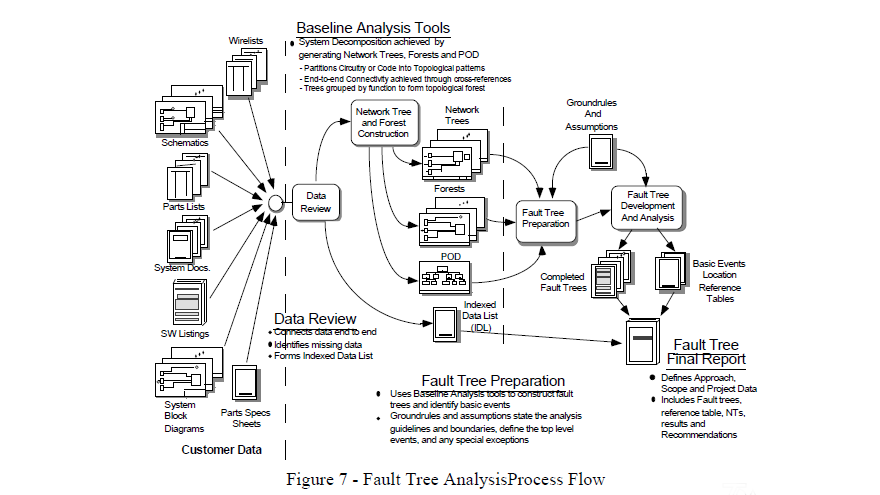
When FTA and Sneak Analysis efforts are integrated, the combined contribution of component failures and sneak conditions can be analyzed. The network trees and forests created as part of the Baseline Analysis Tools during a Sneak Analysis are used to convert the system’s circuitry and software into the graphical fault tree. This process is shown in figure 7.
The forests constructed during the Sneak Analysis are used as an outline for constructing the fault trees. For example, the forest constructed for an output such as the one shown previously in figure 6 acts as the structural outline for the fault tree which involves the output of data. The paths from right to left in the forest leading back through the various network trees are the same that would appear in the fault tree from top to bottom.
The network trees provide the details necessary to determine how the output event of that tree occurs with different failures. Functions and paths are clearly laid out on network trees and forests, which avoids one of the most common causes of errors in constructing fault trees. Such as when high-level design data are used for constructing fault trees, cause and effect
relationships are sometimes left out because they simply do not appear in the high-level design data. Confusion and lack of understanding can also result regardless of amount of detail in the design data, because: 1) Most of the data that represents a system are organized for manufacturing purposes. These data with their many crossed signal lines can hamper complete understanding of all the ways in which the system reflects a failure, and 2) Most systems are split up among multiple contractors which separate the system and design data into pieces. This division can separate data so much that any detailed understanding of even a single function is difficult at best.
The fault tree house event and inhibit gate are used to show the combined effects of sneak conditions and failures. A sneak condition may affect only part of a system in a way, which under normal circumstances, has no system impact. However, when the sneak condition is combined in the Fault Tree with some combination of failures, the effect of the sneak can be catastrophic. Also, the probability of the top event may increase considerably when the sneak condition is "turned on" using a “house” event. Therefore, a sneak condition, which would be considered as an acceptable risk for a stand alone Sneak Analysis, now becomes a safety critical event when viewed in conjunction with fault conditions.
Integrated Sneak Analysis with a Hardware/Software Failure Modes, Effects, and Criticality Analysis (FMECA)
A Hardware/Software Failure Modes, Effects, and Criticality Analysis (FMECA) is a systematic way of evaluating the effects that a particular software module or hardware component failure has on a system. The HW/SW FMEA identifies modules or functions critical to system operations, which can be targeted for redundancy, fault tolerance, or additional compensating provisions. For the Criticality Analysis, the failed components are assigned a criticality number so that the design team will know which components are most critical to the safe and reliable operation of the system.
This integrated approach uses the Baseline Analysis Tools created during an Integrated Sneak Analysis along with the understanding and knowledge gained about the system. The forests generated as part of the Baseline Analysis Tools are used as a ready made map of all the system effects and with minor modifications can virtually be used directly as the Functional Block Diagrams (FBD) needed to perform the HW/SW FMEA. Also, since the forest blocks are made up of individual network trees, which by definition are single functions of the system, the Reliability Block Diagrams (RBD) can be created for all the highest system level indentures.
The HW/SW FMECA considers the failure modes of every hardware/software module/function and component of the system in an organized methodical manner using FBDs, RBDs, the Software Sneak Analysis Program Organization Diagram (POD), and the network trees to identify the failure effects on system operations. The FMECA worksheet database can be automatically extracted from the Baseline Analysis Tools cross-reference database. This assures a complete, accurate, and cost-effective basis for the analysis. The HW/SW FMECA process is shown in Figure 8.
Using the cross-reference database of the hardware and the software network tree components provides all the necessary baseline data to create the entries for the FMEA and CA worksheets. A relational database easily uses this input data to compile worksheets with the corresponding failure modes at the appropriate level of detail required for the analysis. Additional reports can be tailored with the database to fit special requirements. The descriptions of all failure effects along with their resultant criticality numbers can be compiled into the worksheets for fast and convenient review
The Software Failure Mode and Effects Analysis (SWFMEA) part is used to identify weaknesses in hardware/software interfaces of a system as a step toward providing failure mitigation through the use of software. A basic assumption is that a software failure mode is one in which the function, for whatever reason, no longer performs the design intent.
The SW FMEA can identify the areas of software failures that result in specific system effects. An effective performance of the HW/SW FMEA is assured by using a team with hardware, software, and system analysis expertise. In addition to the prime use of
identifying safety or reliability critical failure modes and effects, the analysis can provide rationale for changes in operations or design for correcting and/or mitigating the effects of the undesired failure modes. HW/SW FMECAs are also beneficial in the preparation of test procedures and troubleshooting failed systems.
Conclusions
An Integrated Sneak Analysis approach and the use of the Baseline Analysis Tools provide a cost effective and efficient method to improve safety and reliability. Sneak Analysis finds problems not found during design, simulation, test, or other analyses. Thus, reducing the number of problems during test and startup, and reducing operational problems in the field. The Baseline Analysis Tools provides the means of combining the non-failure domain Sneak Analysis with other failure domain analyses using significantly less effort, time, and cost. This approach can achieve coverage of the entire failure and nonfailure spectrum. Furthermore, the Baseline Analysis Tools are also useful for evaluating design changes, test planning, and troubleshooting.
To maximize the benefits, the Integrated Sneak Analysis should be performed to the detailed component and software instruction level. Sneak Analysis can also be performed at any level necessary to achieve the desired results if limited by time, scope, and/or cost. For example, it can be performed individually on the hardware or software, and then interfaced to the other. Lastly, Sneak Analysis can reduce schedule risks and costs by detecting errors before production and testing.
References
1. MIL-STD-785A Notice 2 (5 August 1988), Reliability Program Plan for Systems and Equipment, Task 205.
Biography
Henry D. Valdez, BS EE, President, Independent Design Analyses, Inc., P.O. Box 890541, Houston, TX 77289-0541, USA, telephone - (281) 488-8968, facsimile - (281) 992-7680, email - hdvaldez@ida-inc.com.
Mr. H. D. Valdez has been president of Independent Design Analyses, Inc. since 1993. He has over 21 years experience in performing Hardware/Software Sneak Analysis (HW/SW SA), Failure Mode Effects and Criticality Analysis (FMECA), Traceability Analysis, Hazard Analysis, Fault Tree Analysis, Reliability Prediction, Worst Case Analysis, Reliability Block Diagram Analysis (RBDA), and Maintainability Analysis. His experience includes Electronic Engine Control, Automatic Flight Control, Aircraft Power Distribution, advanced missile and weapon systems, and Design Verification/Reliability Engineering. He holds B.S. in Electrical engineering from Texas A&I University
