By: James L. Vogas, Boeing Aerospace Operations, Inc.
Houston, Texas
Abstract
Boeing developed the Sneak Analysis technique for the manned space program in 1967 to find unintended modes of behavior that are not caused by component failure. Since that time, it has been applied to many types of systems, including military, nuclear, automotive, mass transit, medical, and petrochemical. Complete systems including software, hydraulics, pneumatics, as well as electronic hardware, can be analyzed for sneak conditions. Circuitry can include combinations of analog and digital technology. Hybrids and application-specific integrated circuits (ASICs) can be easily accommodated.
This paper explains the basic steps in the Sneak Analysis technique, shows the differences between the Sneak Analysis approach and other design analysis approaches, and provides several examples of sneak conditions. Relationships to other design analyses are discussed and advantages of integrating Sneak Analysis with other design analyses are shown. Conclusions drawn from actual applications are presented.
Background
A sneak condition is a latent hardware, software, or integrated condition that may cause an unwanted event to occur or may inhibit a desired event and is not caused by component failure.
Symptoms of sneak conditions include system problems that are nonrepetitive through tests or simulations, problems which conventional analyses cannot detect, self-clearing problems, and higher failure rates than expected.
Three main factors cause sneak conditions. These are called the spaghetti factor, the tunnel vision factor, and the human factor. The spaghetti factor, as its name implies, deals with the entanglement of functional and electrical paths. This occurs both in the actual system design and in the data that represent the system. Contributors to the spaghetti factor include the size and complexity of modern systems and the layout of data. The numerous inputs and outputs which are crossfed resemble a bowl of spaghetti. Most of the data that represent a system are organized for eventual manufacturing purposes. These data with their many crossed signal lines can hamper complete understanding of all the ways in which the system may behave.
The tunnel vision factor deals with the splitting of the design and the system documentation into pieces. Most systems are split up among multiple contractors. Each contractor may split the design responsibility into various departments. Technology specialists, such as digital designers, analog designers, software engineers, power supply designers, and ASIC designers add to the separation by speaking different languages if they speak to each other at all. This division causes data segregation so complete, detailed understanding of even a single function is like traveling a maze. Further, changes to the original design complicate matters and have proven to be a source for introducing sneak conditions into previously clean functions. Because limited budgets are always a problem, there is a desire not to replicate what the designer of the interfacing equipment or software is doing; therefore the "big picture" is sometimes not seen.
The third contributing factor to sneak conditions, the human factor, involves people in the design and operation of a system. During design, two people working from a specification may interpret that specification in different ways. This can result in an incompatible design interface. This often results in designs that work in the lab and even most of the time in the field. However, these differences cause occasional and sometimes very serious results for which an explanation is often difficult to find. The human operator of a system can also be a contributor to the occurrence of a sneak condition. Operators may be faced with ambiguous procedures, controls that do not do exactly what their labels indicate, and system indicators that may not provide the actual system status. The operators may have to make split-second decisions based on these indicators in panic situations. Such situations are likely to prove an axiom of Murphy's law that states: "The likelihood of a sneak condition occurring is proportional to its criticality to safety or the rank of the visitor who is watching the demonstration."
Sneak Analysis is a method of finding latent undesirable conditions in systems through the application of clues to topological network trees and forests. The use of network trees and forests reduces the spaghetti factor by separating functions onto individual network trees and forests. It reduces tunnel vision by combining piecemeal functions from various data sources and physical locations onto a single network tree and combining hardware and software subfunctions onto forests. They also allow evaluation of human factors. Clue application is not limited to specified procedures or mission profiles as are simulation and testing. Therefore, simulation and testing may not reveal sneak conditions.
History
Sneak Analysis originated from a NASA contract with Boeing to support the Apollo program in 1967 after the Apollo 1 capsule fire. NASA was having increased concern with the ability of redundancy to handle unexplained, unintended, and untimely events. In addition, configuration control problems and differences between design intent and as-built circuitry in systems of increasing complexity and size were becoming more evident. As part of this contract, a historical search of sneak conditions which had actually occurred was begun. Sneak events studied included a missile accidentally launched from a B-52 bomber while parked on the ground, bombs accidentally released from a B-52, a nuclear bomb inadvertently armed, a business jet which lost electrical power and drained its batteries while in flight without any indication to the crew, and an electric utility lineman electrocuted while working on a power line to which the power was "off." All of these events occurred without the failure of any components. One case studied involved the mysterious activation of fire alarms at a public school during recess and lunch. The school administration could not catch anyone pulling the alarms, nor was there any evidence of alarms being pulled. Investigation revealed that the alarm system was designed to be triggered by activation of the automatic sprinkler system through water pressure sensors. However, flushing a particular number of toilets would cause the same pressure drop at one of the sensors.
Research has shown that sneak conditions are universal. They can occur in all types of systems and all types of circuitry and software. The technique has been applied successfully to a number of industrial facilities including hydrocarbon processing plants and electronic governors on steam turbines for large, multinational companies. Other industrial applications of Sneak Analysis have included offshore drilling platforms, power-generation plants, nuclear plants, medial devices, and rapid transit systems. While experience has shown that large, complex systems are more likely to contain sneak conditions, significant results have also been obtained on small systems. For example, a recent Sneak Analysis of a "simple" battery charger resulted in thirteen circuit design changes.
Where cost is a limiting factor, Sneak Analysis of critical functions can be performed with excellent results. The tools that are used in Sneak Analysis to trace all paths that affect a system output can be used to determine the critical paths that affect a selected output. However, application of the technique to a preselected small component of a large system is usually not as beneficial. This usually partitions the system along the same boundaries that hide sneak conditions from the system designers. Also, preselected components may contain noncritical circuitry and software, and excluded components may have critical sneak effects.
Advancements in Sneak Analysis
Sneak Analysis began with the analysis of power and control systems that mostly consisted of relay logic in 1967. Sneak Analysis of software began in 1972. Techniques for digital circuits and analog circuits were developed in 1975 and 1976, respectively. Sneak Analysis of hybrid circuits was underway by 1978 and programmable array logic was included in Sneak Analysis by 1987. In 1989, Sneak Analysis of systems containing ASICs began.
The Sneak Analysis Process
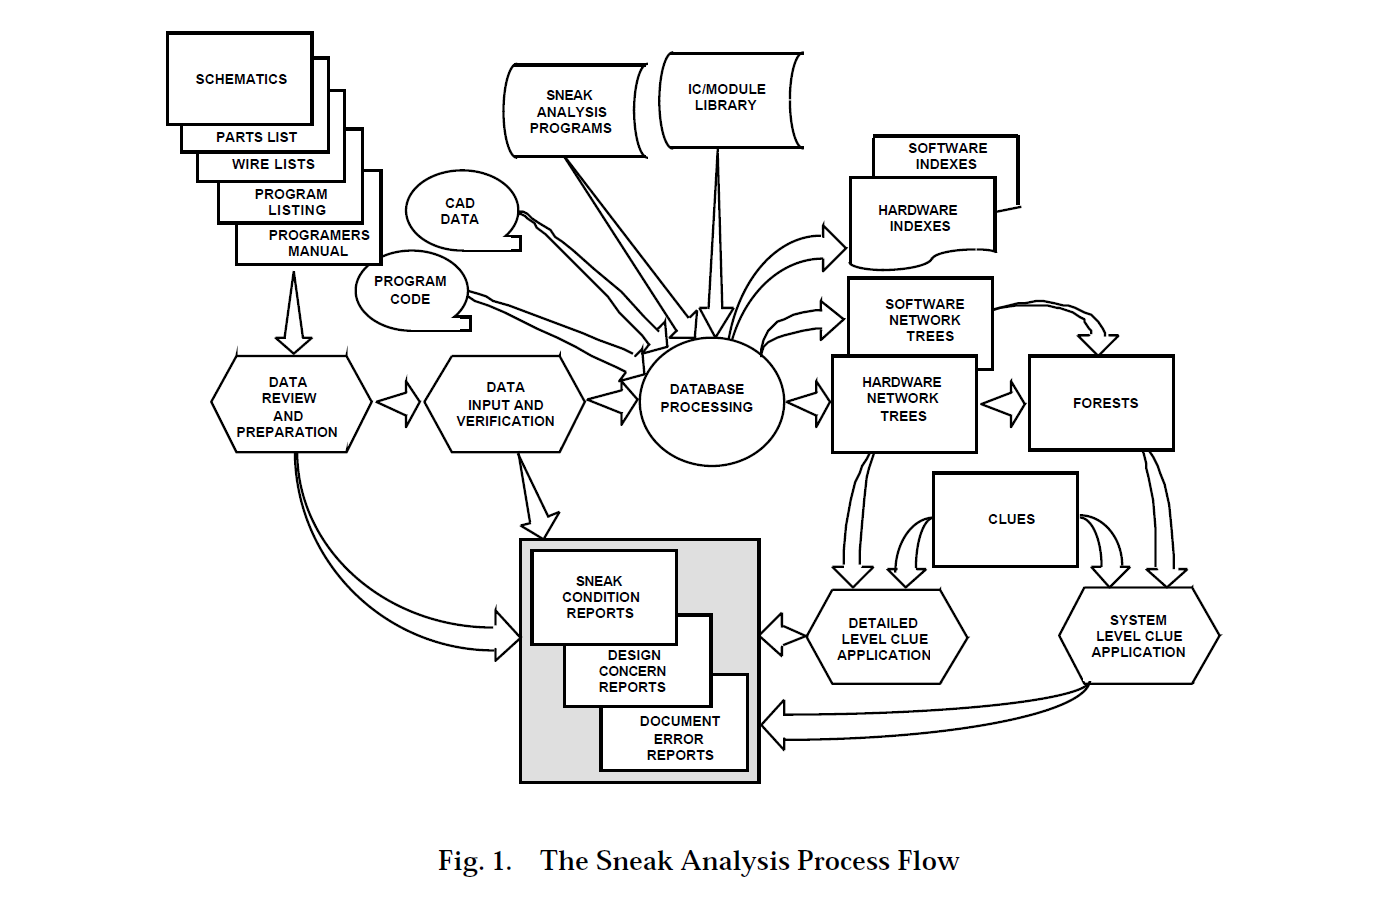
The flow of the Sneak Analysis process is shown in Figure 1. Data that are as close as possible to "build from" information that represents the details of the system hardware and software are reviewed and entered into the Sneak Analysis relational database. Whenever possible, computer-formatted data such as hardware netlists and software program code furnished on magnetic media are directly loaded into the system. Computer processing combines these data with a library that provides details of electrical component and software language operation. The tracing of electrical current flow, software program flow, and functional data flow paths by the Sneak Analysis programs results in topological network trees and forests.
The network trees show individual functions that may cross through multiple physical boundaries such as circuit cards, boxes, or cables. Figure 2 shows a sample hardware network tree. Note that this network tree integrates circuitry contained on two circuit boards, a control panel, an ASIC, a motherboard, and several cables.
Components and nodes are arranged so that current flow is from top to bottom and signal flow is from left to right. Adjacent nodes, even if located in separate assemblies, are collapsed into a single node. Also, the number of line crossings is minimized and symmetry and duplication are maximized where applicable.
The symbols used on network trees are dynamic. If a network tree shows a particular output of a device, then all inputs on that device that functionally affect that output are shown. Any input or output that has a direct electrical path through that device is also shown on that network tree. However, any other inputs or outputs for that device are not shown on that network tree. The size and composition of the symbol are also adjusted to accommodate the number of inputs and outputs shown. These dynamic symbols are another way in which the spaghetti factor is reduced.
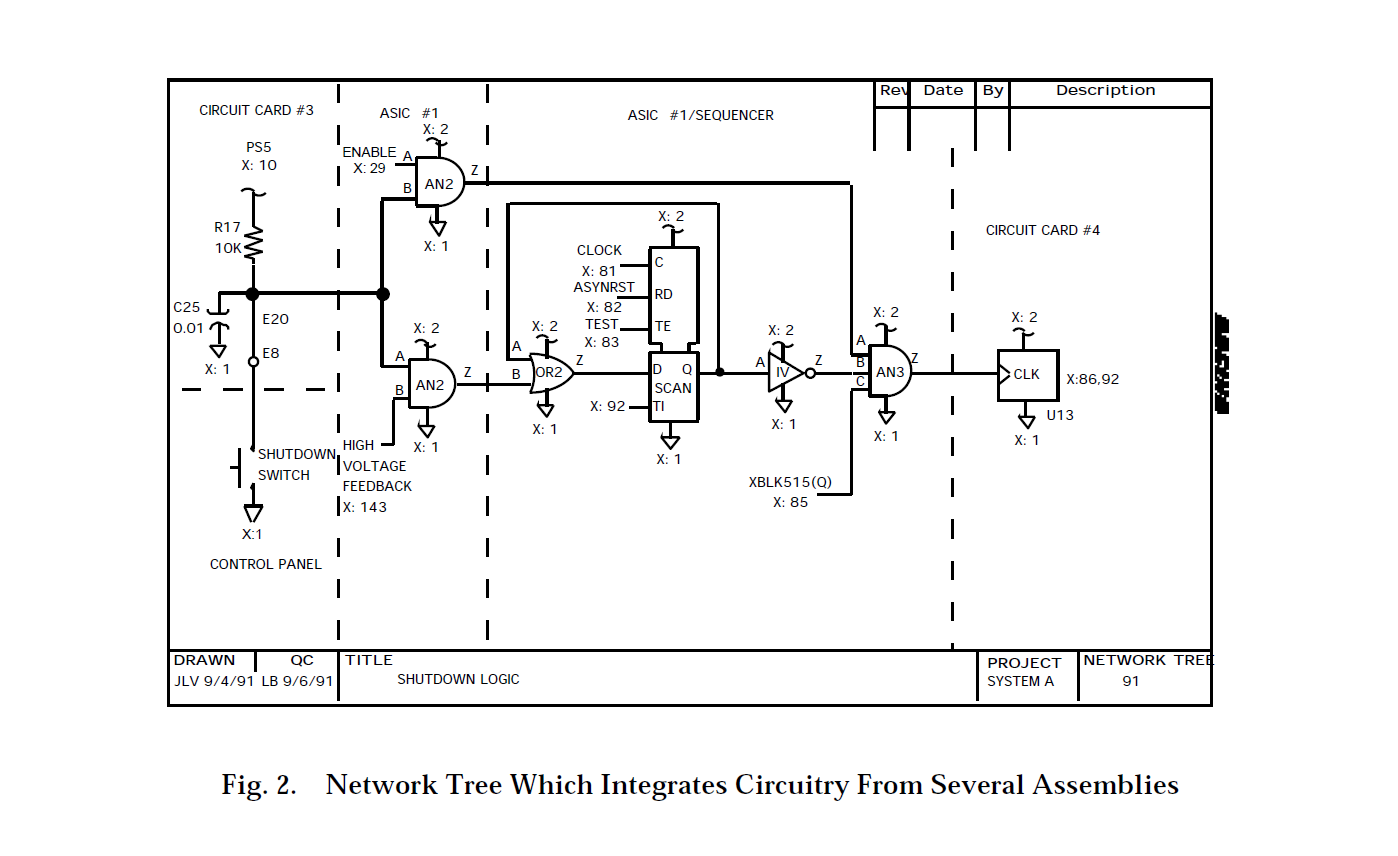
Typically, each network tree has a single output. All contributing inputs that may affect that output are shown on that tree. Electrical current flow and system data flow are maintained through cross-references placed on the network trees. Crossreferences are noted by X: followed by the cross-referenced network tree numbers. These cross-references link network trees into network forests.
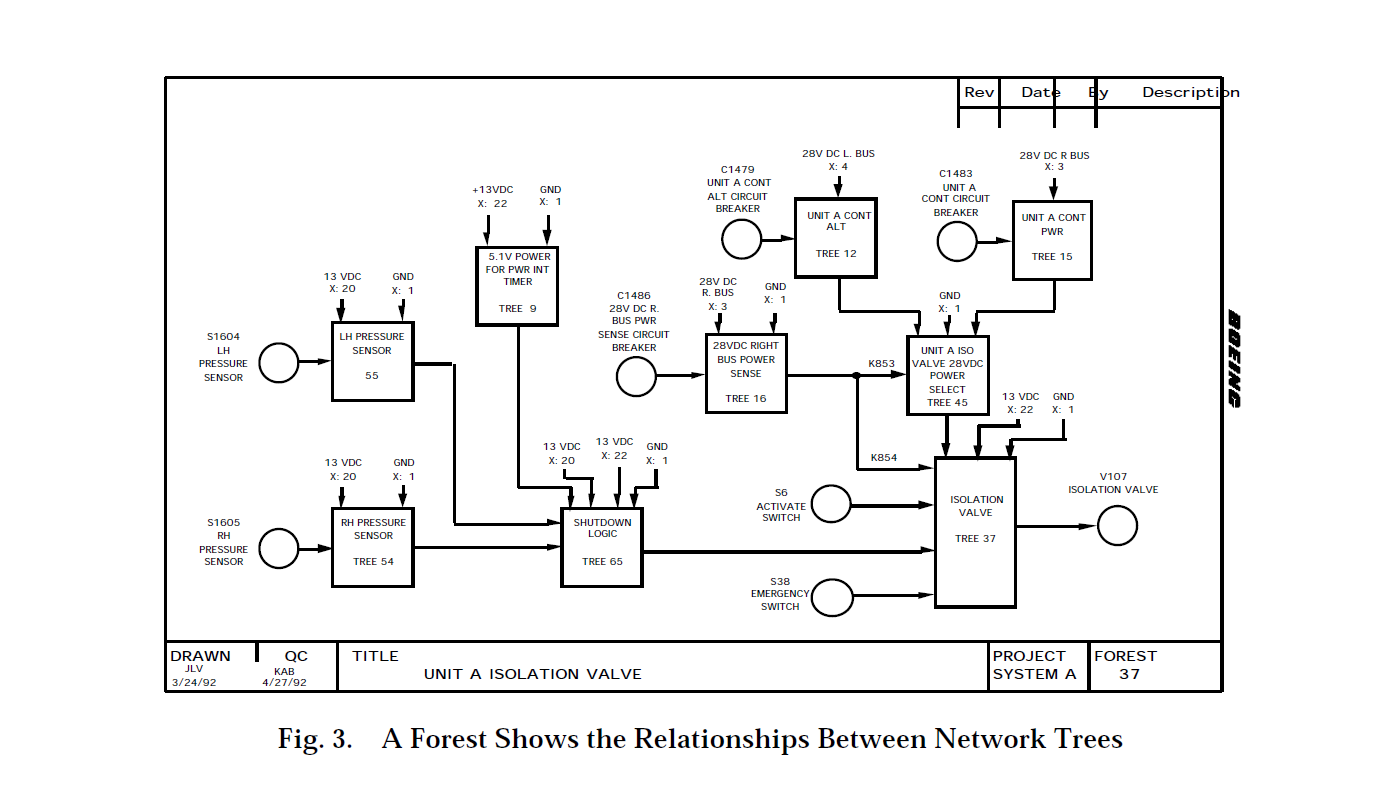
A forest is a graphical representation of those functionally related network trees that define a system output in terms of its controlling inputs. A forest is usually developed for each physical output of a system such as valves, heaters, motors, and indicators. Each network tree that contains a system output becomes the starting point for constructing a network forest. A sample forest is shown in Figure 3.
Forests are drawn starting with the system output on the right side of the forest. Each block in a forest represents a network tree. Directional interconnecting lines show the input/output relations between the network trees. Each forest can contain hardware and software trees.
Forests provide a unique representation of a system function that is difficult to see in design data. Forests show how the network trees relate to one another and provide a system-level view of a particular system output function. A forest will show all inputs that can affect the forest output.
Clue Application
A clue is a recognizable pattern that directs the analyst to review a specific set of questions. These patterns are easily identifiable on the topological network trees and forests. The questions identify which of the circuit's inputs must be evaluated for a specific clue. The analysts use the forest as a road map through the system during the analysis. One network tree is evaluated at a time starting with the network tree closest to the forest output. Likewise, each network tree is evaluated one node and component at a time starting at the node or component closest to the network tree's output. Each analyst works back toward the inputs that affect the output. If a sneak clue reveals that an undesirable condition may exist, then the combination of inputs required to provide the undesired condition is then determined. If this combination is possible, then a sneak condition exists. The input combination could be static, dynamic, normal or abnormal.
Sneak Analysis can also be applied to software and to integrated hardware/software systems where hidden modes of hardware/software interaction may exist.
For hardware, the clues are subdivided into electrical and functional categories. There are also functional clues for forests. Some of the forest clues are identical to network tree clues, while others are unique to forests.
Sneak Electrical Path Example
The most basic type of sneak condition is the sneak electrical path. This usually exists where multiple inputs control multiple outputs. A simple example, which existed in thousands of cars in the 1950's, is shown in Figure 4.
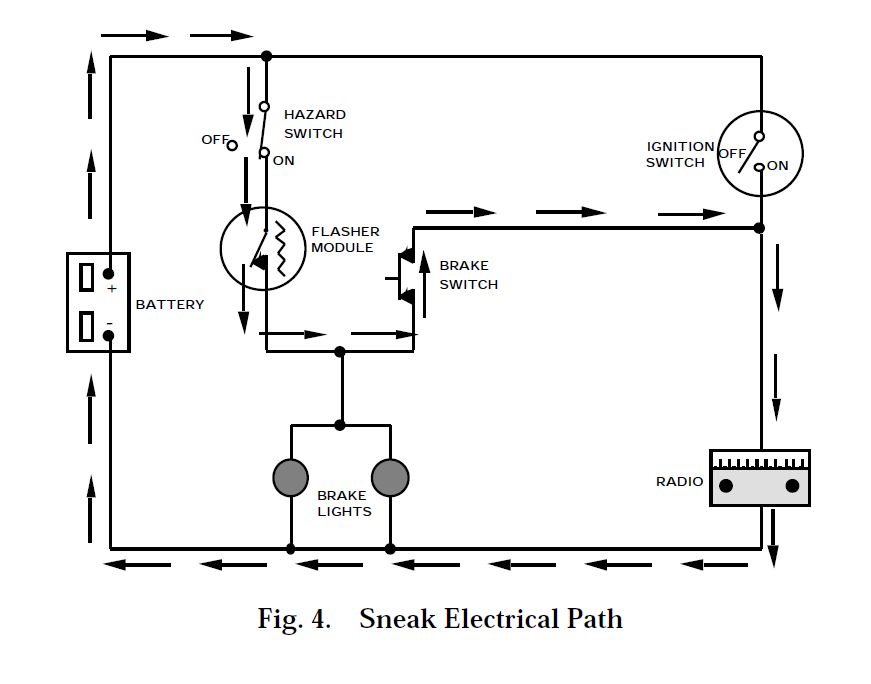
The design intent is that the brake lights be controlled by the hazard switch and flasher module combination, or by the brake switch and ignition switch combination. It is also intended that the radio be controlled by the ignition switch. All of these intended paths work as expected. However, there is an additional, unintended path shown by the arrows in Figure 4. With the ignition switch off, the hazard switch closed and the brake switch closed, the radio may be played in bursts. This sneak involves current flowing through the brake switch in a "reverse" direction. The pattern in which the sneak can be easily seen is called the "H" pattern, which is shown in the topograph of Figure 5. The horizontal bar in the H pattern can allow current to flow in either direction. The analyst must determine if both directions are intended.
Sneak Timing Example
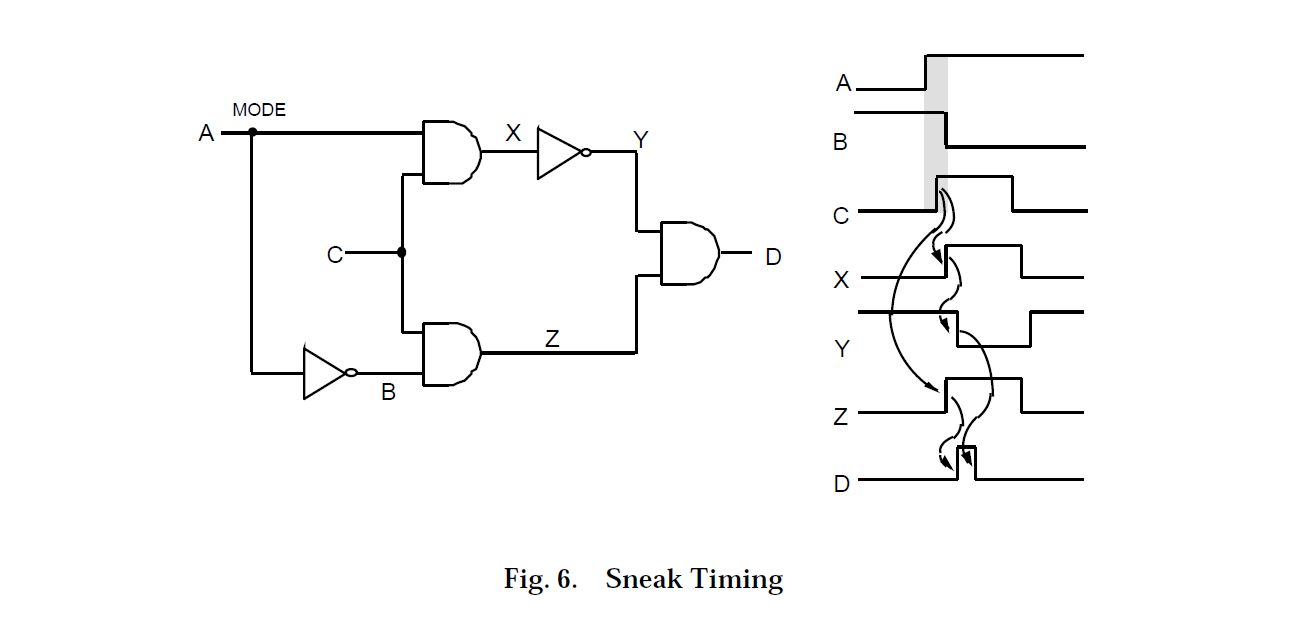
Another type of sneak condition is sneak timing. In the example circuit of Figure 6, if signal "A" is in its low state, the signal transmitted from point "C" to point "D" will be uninverted. If signal "A" is in its high state, the signal transmitted from point "C" to point "D" will be inverted. However, if signal "A" transitions to a high state just slightly ahead of signal "C," then the signal at point "D" will contain an unintended spike or glitch. The circuit contains a clue that a sneak timing condition is a possibility. That is, signal "C" splits and travels through two parallel paths that rejoin at signal "D" and one of these paths has an odd number of inversions while the other path has an even number of inversions. A similar situation exists for signal "A." In this simple example, these paths are evident from the schematic; however, in a real system, the paths may be very long, and may contain many gates, other circuitry from various assemblies, and even software. The network trees and forests integrate large amounts of design data to allow these paths to be seen.
After discovery of the clue and possible glitch, the analyst must ask two questions. The first question is, "Will the glitch have an impact on the system?" For instance, if the glitch is fed to a light bulb, it will not be seen. However, if the glitch is fed to the input of several digital latches, some of the latches may respond to it while others may not. This could then throw the system into an illegal state.
The second question is, "Can the required input timing relationship exist?" To answer this question, the analyst can trace signals "A" and "C" back to their origins using the forest. If signals "A" and "C" are controlled by a common element where signal "C" occurs substantially after the positive transition of signal "A," then the sneak condition cannot occur. If the two signals are controlled by a common point, there may still be some variable in the timing of these signals that may allow the sneak condition to occur. Another possibility is that the origins of signals "A" and "C" do not have any common element. In this case, the sneak condition is possible because there is nothing to prevent the required timing relationship from occurring. It is, then, a matter of chance.
Integrated Hardware / Software Example
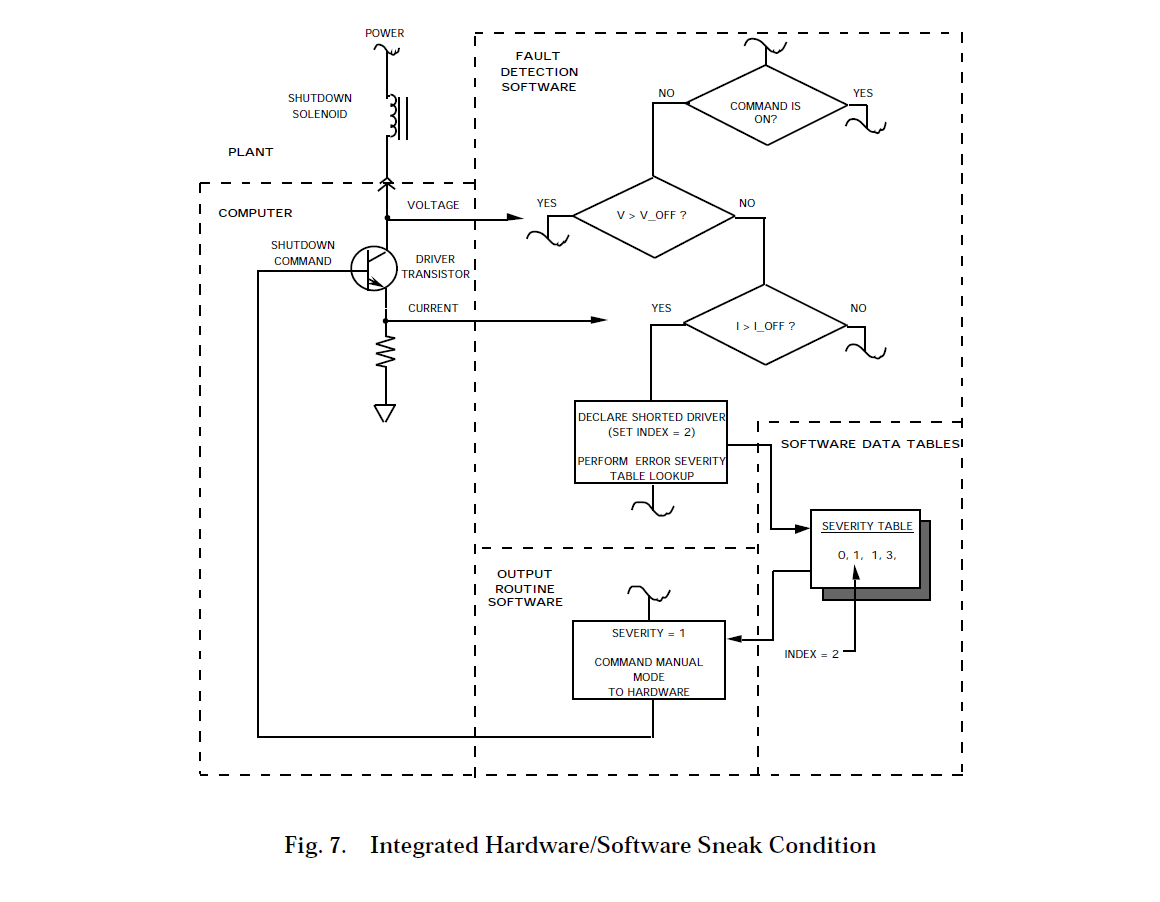
An increasingly common type of sneak condition involves both hardware and software. In one system analyzed, the fault detection software monitored the condition of several solenoids and their driver circuits for faults. A generic software loop checked each solenoid during each execution of the major software loop, or about once every half second. If a critical problem (severity 1) was detected, the software would command a system shutdown as required by the system specification. However, as shown in Figure 7, one of the monitored solenoids is the solenoid that initiates the shutdown.
The shutdown solenoid is energized for normal operation and deenergized to initiate a shutdown. If any severity 1 faults are detected in any solenoid and the driver for the shutdown solenoid has failed shorted, the system will try to respond by commanding shutdown. This is normally accomplished by turning off the shutdown driver transistor. However, this is the transistor that has failed shorted and was one of the detected faults. In this case, both the hardware and the software performed according to the specification. However, together and under a particular circumstance, an undesired result was achieved. This sneak condition probably went undetected during the design phase because the tunnel-vision factor is especially strong between hardware and software design groups and there was plenty of spaghetti in the software.
Sneak Analysis Results
Sneak Analysis has a demonstrated record for improving system safety and reliability while reducing overall design and development costs. It has been estimated that for every dollar invested in Sneak Analysis, there are $25 saved in life cycle costs. For example, recent analysis of 10 systems resulted in approximately 300 hardware design changes and 200 software design changes before the systems were built. That averages 50 changes per system. On three systems, changes resulting from Sneak Analysis produced estimated cost avoidances of $33 million, $32 million, and $22 million.
The following are example potential impacts of sneak conditions found in industrial systems:
- Conflicting inputs can be made from multiple operator panels.
- Commands that should be inhibited in a particular mode are still possible.
- Inadvertent automatic initiation of commands.
- Monitoring circuitry inhibited or destroyed by the condition to be monitored.
- Intermittent loss of communication between remote sensors and process controller.
- Damage to components by stresses from sneak paths.
- Built-in-test passes with multiple failures in system.
The following are example types of sneak conditions found:
- Unexpected cause and effect relationships.
- Incomplete logic.
- Conflicting hardware and software paths.
- All modes of operation not defined.
- Software misinterprets functional meaning of input from hardware.
- Mismatched hardware/software interface.
- Hardware incorrectly responds to output from software.
Design concern conditions are also found using the Sneak Analysis technique. These are undesirable circuit or logic conditions which are not sneak conditions but are of concern with respect to system operation, safety, reliability, testability, or maintainability. Design concern conditions identify potential design problems or marginal design practices.
Identification of design concern conditions constitute an additional value of Sneak Analysis and have often resulted in significant project life-cycle cost savings as well as increased reliability, maintainability, and safety. The following are example potential impacts of design concern conditions found in industrial systems:
- Reduced reliability due to unnecessary components or logic.
- Reduced maintainability.
- Susceptibility to noise.
- Single failure points in redundant systems.
In addition to sneak conditions and design concern conditions, numerous document errors are usually discovered throughout the Sneak Analysis process. Documentation problems can affect reliability, maintainability, safety, life cycle costs, future engineering analyses, and future changes.
Integration of Sneak Analysis and Fault Tree Analysis
Fault Tree Analysis (FTA) is used to predict the most likely causes of a predefined undesired event. FTA provides a graphic display that shows the relationship between failures and events. The undesired event is shown at the top of the tree. The tree continues down through functional logic to failures of basic components or commanded events. This concept is illustrated in Figure 8.
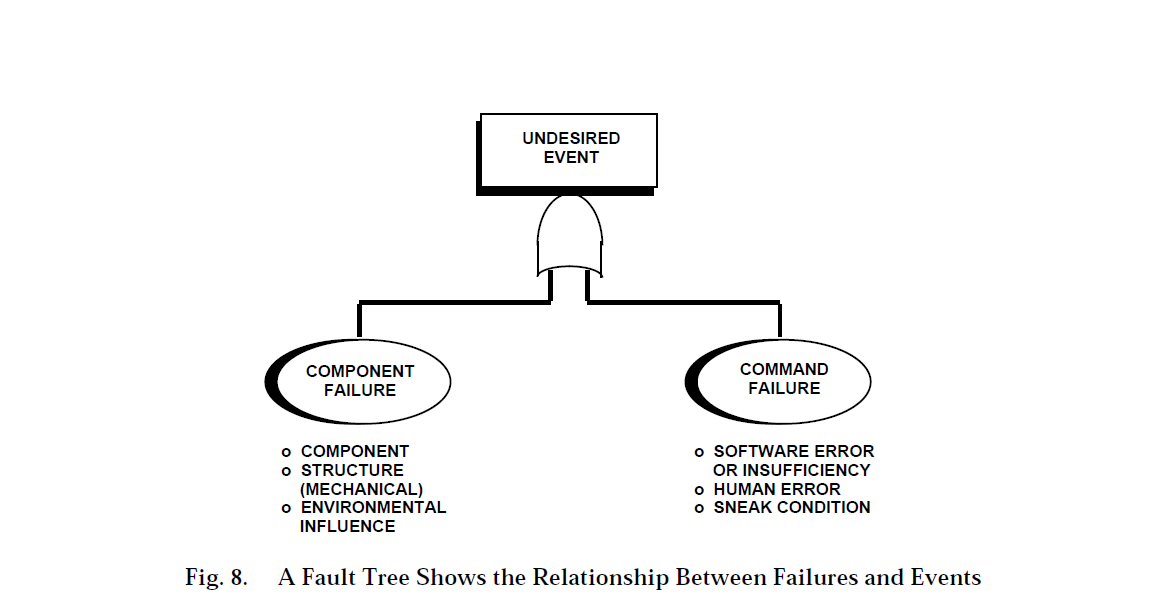
Output reports from the analysis include identification of single and multiple failures that can cause the undesired event; the probability of the undesired event happening for any designated operation period; and a ranking of contributing single and multiple failures with their probability of being involved in the undesired event.
Computer controlled systems can be analyzed by constructing integrated hardware/software fault trees that cover hardware through pertinent software routines and back through additional hardware. Network trees and forests generated during a Sneak Analysis may be used to convert the system circuitry and software into the graphical fault tree. When FTA and Sneak Analysis efforts are integrated, the combined contribution of component failures and sneak conditions can also be analyzed.
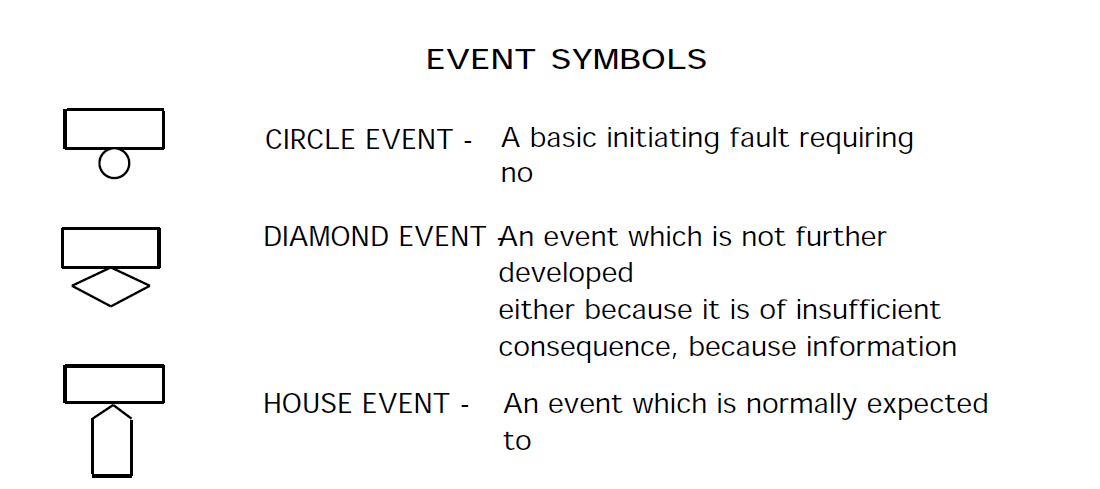
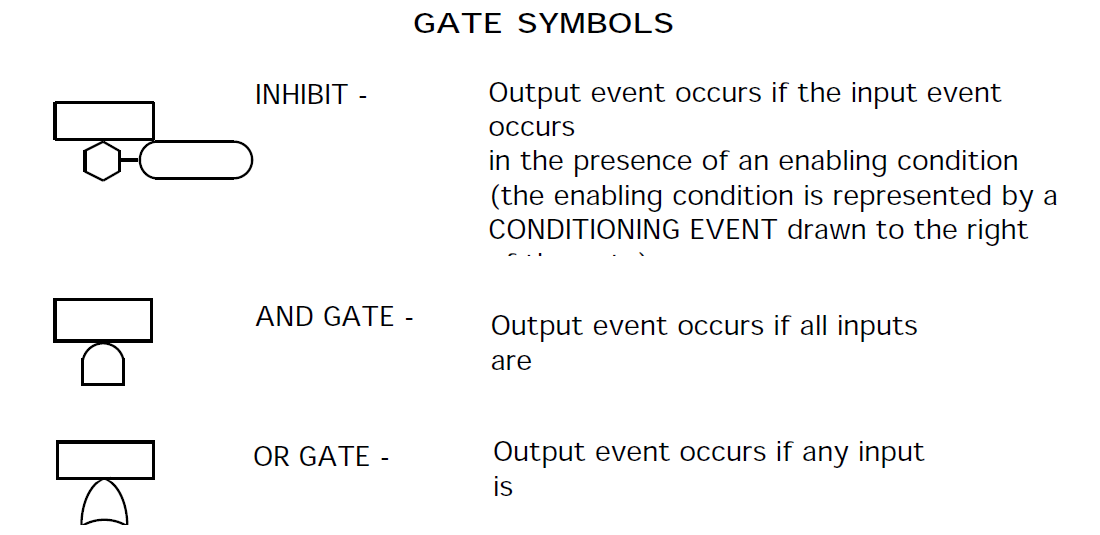
The fault tree is developed for the defined top undesired event including required operational conditions. Below the top undesired event all operational or component failure events that lead to the top event happening are placed in sequential order using Boolean logic to represent the required operating mode of the circuitry. Figure 9 defines the symbols used on fault tree plots. If one of several events can cause the event above them, they are under an OR gate. For example, under the event "Loss of high pressure pump" might be an OR gate with the events "Mechanical failure of high pressure pump" and "Loss of electrical input to high pressure pump." If all events under an event must occur for the above event to occur, they are under an AND gate. The fault tree development continues down to input controls and basic components.
Event Symbols
Gate Symbols
Transfer Symbols
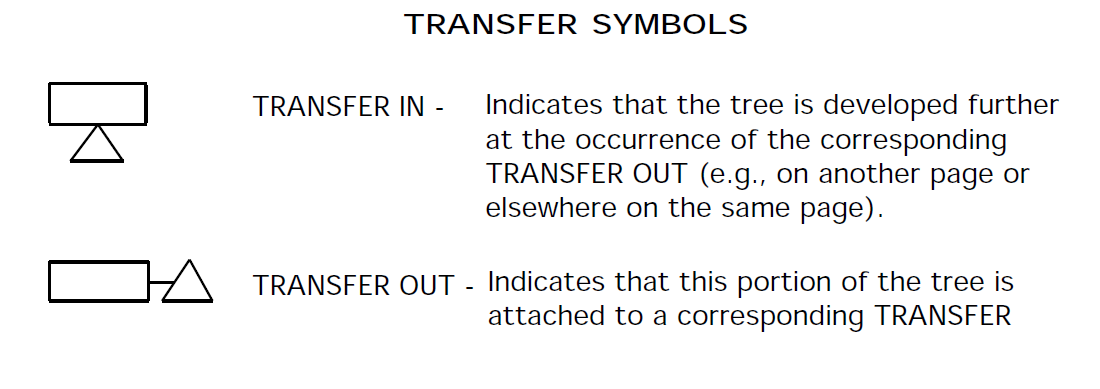
The forests constructed for the Sneak Analysis can be used as an outline for constructing a fault tree. For example, the forest constructed for an output such as a valve solenoid or pump motor would act as the structural outline for the fault tree which involves that valve or pump. The paths from right to left in the forest leading back through the various network trees are the same as those which should appear in the fault tree from top to bottom.
The network trees provide the details necessary to determine how the output event of that tree may be initiated by various failures. Functions and paths are clearly laid out on network trees and forests, thus avoiding one of the common causes of errors in constructing fault trees. When high-level design data are used for constructing fault trees, some cause and effect relationships are sometimes omitted because they do not appear in the high-level design data. When detail-level design data are used, confusion can result because of the spaghetti and tunnel vision factors associated with such data.
A label appears in the rectangle that is part of each symbol. Labels for gate events describe the failure event that is happening below the gate. Labels for basic events (circles and diamonds) describe the part that has failed and mode it has failed in (Resistor R54 fails open). Labels for house events describe the event that is normal for the system during the mode of operation (+28Vdc is present). Labels for inhibit events describe the condition (inhibit) for the events below the following AND gate.
The house event and inhibit gate are used to show the combined effects of sneak conditions and failures. A sneak condition may affect only part of a system in a way, which under normal circumstances, has no system impact. However, when the sneak condition is combined with some combination of failures, the effect of the sneak may be disastrous. Also, the probability of the top event may increase considerably when the sneak condition is "turned on" using a house event. Therefore, a sneak condition that was considered as an acceptable risk may be classified as critical when viewed in conjunction with fault conditions.
Integration of Sneak Analysis and Failure Modes, Effects, and Criticality Analysis
Failure Modes, Effects, and Criticality Analysis (FMECA) is a systematic way of evaluating the effects that a particular component failure has on a system. The failed component can then be assigned a criticality number so that the design team will know which components are most critical to the safe and reliable operation of the system. FMECAs are also beneficial in the preparation of test procedures and troubleshooting failed systems.
A relational database can be used to help provide accurate, efficient processing of data and documentation of results. The descriptions of all failure effects along with their resultant criticality numbers are compiled in easy-to-read worksheets for fast and convenient review. Additional summary reports can be tailored to fit special requirements.
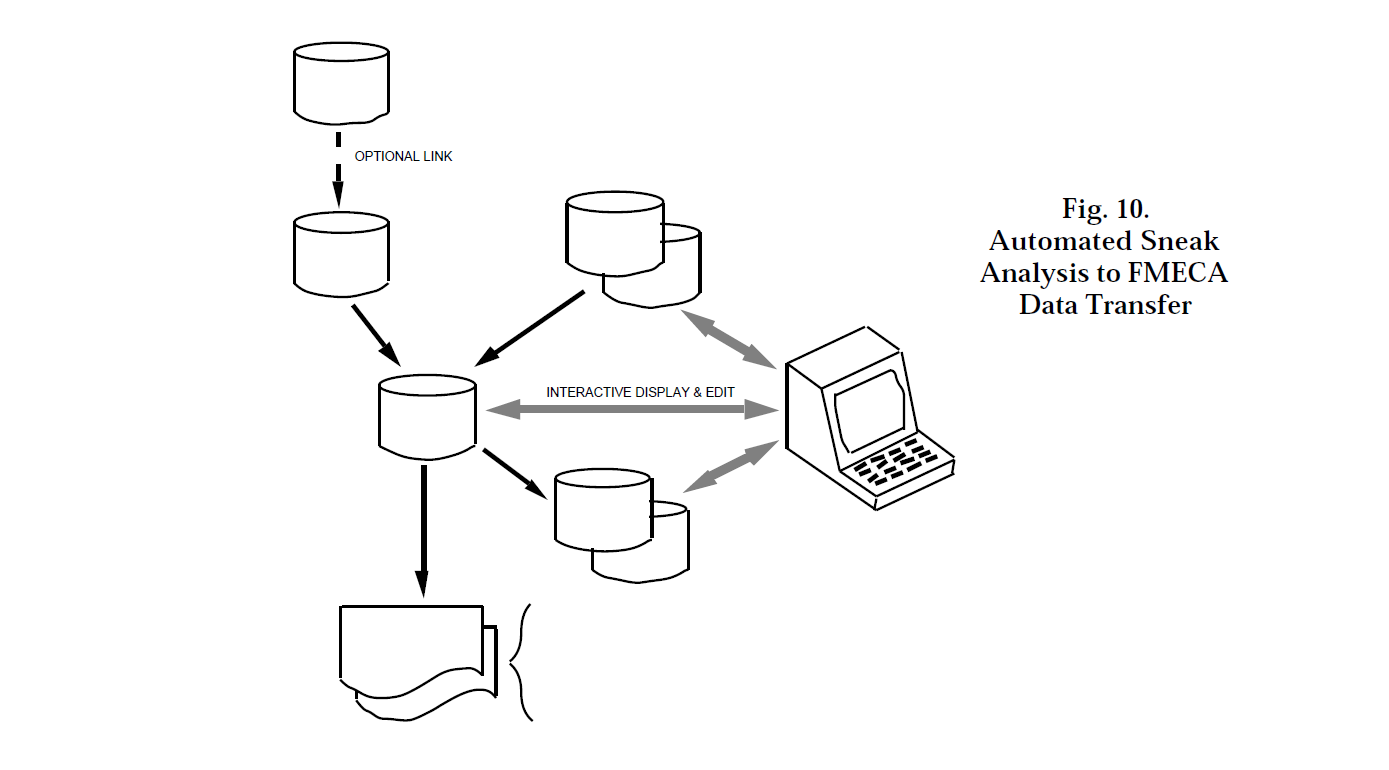
Accompanying the reports are various diagrams that show the functional relationships of the components of the function, redundancy relationships in the system, and the relative severity of each failure. If the FMECA is performed along with a Sneak Analysis, the FMECA database can be automatically extracted from the Sneak Analysis database, as shown in Figure 10. This assures a complete, accurate, and cost-effective basis for the analysis.
Conclusions
Sneak Analysis of process control systems improves safety and reliability. The analysis should include both the hardware and software. Analysis should be performed to the detailed component and software instruction level. Sneak Analysis can reduce schedule risks and costs by detecting errors before construction and testing. Sneak Analysis finds problems not found during design, simulation, test, or other analyses. Therefore, Sneak Analysis can reduce the number of problems found in test and startup, and reduce operational problems in the field. Detailed topological diagrams are also useful for other analyses, evaluating design changes, and test planning and troubleshooting.
In the petrochemical industry, Sneak Analysis has uncovered potentially costly sneak conditions in several types of systems. Timely alleviating measures were implemented and potentially very costly downtime events were avoided. Sneak Analysis is thus a valuable operational failure avoidance and reliability improvement tool for modern hydrocarbon processing plants.
