By: C. Andy Hailey, Boeing Aerospace Operations Houston
Boeing Aerospace & Electronics
Presented at
the University of Michigan
Quality Assurance Seminar
Traverse City, Michigan
August, 1898
Introduction
The development and introduction of complex, highly integrated electrical/ electronic and microprocessor based systems into new products poses a major challenge to the automotive industry. That challenge is to introduce these new technologies while continually improving the quality of the automotive product. Many of the tools needed to meet this challenge have been developed in the aerospace industry and are available to support automotive requirements. Sneak Analysis is such a tool. Applied by Boeing to automotive systems since 1981, Sneak Analysis identifies and corrects reliabilityrobbing design conditions, called sneaks, that frequently evade detection by traditional analysis and testing procedures.
Sneaks are latent design conditions, some would describe them as design flaws, which have unknowingly been incorporated in system designs. Sneaks can cause an undesired event to occur or prevent a desired event from happening. Sneak Analysis was originally developed by Boeing in 1967, with NASA funding, to evaluate only electrical circuitry. Subsequent Boeing funded improvements have extended the technology to cover computer software and, most critically, complex designs that integrate hardware and software. Boeing has applied the technology in over 200 projects for commercial, NASA, Department of Defense, and Boeing customers. In these projects, approaching 5,000 sneaks have been identified and corrected resulting in cost savings of 100's of millions of dollars through avoided: loss of systems, project delays, rework, warranty claims, recalls, and litigation.
The automotive industry devotes substantial effort to analyze, check, and test these complex integrated systems, yet an unacceptable number of problems still reach the customer. The increasing complexity of future automotive systems offers no relief.
Boeing's recent automotive experience with its Sneak Analysis evaluation service has provided strong direction on how future Sneak Analysis development should proceed. This experience has validated the technology as effective in evaluating complex automotive eIectrical / eIectronic hardware, software, and integrated systems. However, as opposed to aerospace, the number of automotive design strategies requiring analysis is much greater, and the time available for design assessment and analysis is much smaller. Thus, to meet the needs of the automotive industry requires a dramatic reduction in the time required per Sneak Analysis. Also, for Sneak Analysis to become an important automotive technology requires that it be effectively transferred and thoughtfully integrated into the automotive design development and analysis process. As a result, the automotive industry has brought to bear strong pressure for an evolutionary development of the Sneak Analysis technology to provide increased productivity and permit its wide spread dissemination. Boeing strongly supports these technology initiatives. The answer is a Sneak Analysis Workstation which integrates proven artificial intelligence, rule-based approaches, with state-of-the-art database technology coupled to a powerful graphics user interface.
Sneak Example:
Simple Automotive System
A simple automotive example is useful to understand the basic concept of what a sneak is and how it occurs. Complex examples and added detail are included in Section 6. SNEAK ANALYSIS APPLICATION. Figure 1 shows a simplified representation of a mid-1960's automotive electrical circuit. The circuitry design contains all of the functionality intended by the designer. The design meets the electrical system specification, e.g. when the ignition switch is on, power is supplied from the battery to the radio, and if the brake switch is closed, the brake lights receive power from the battery. Also, if the hazard switch is closed, and the ignition switch is off, power will be supplied from the battery to the flasher module causing the brake lights
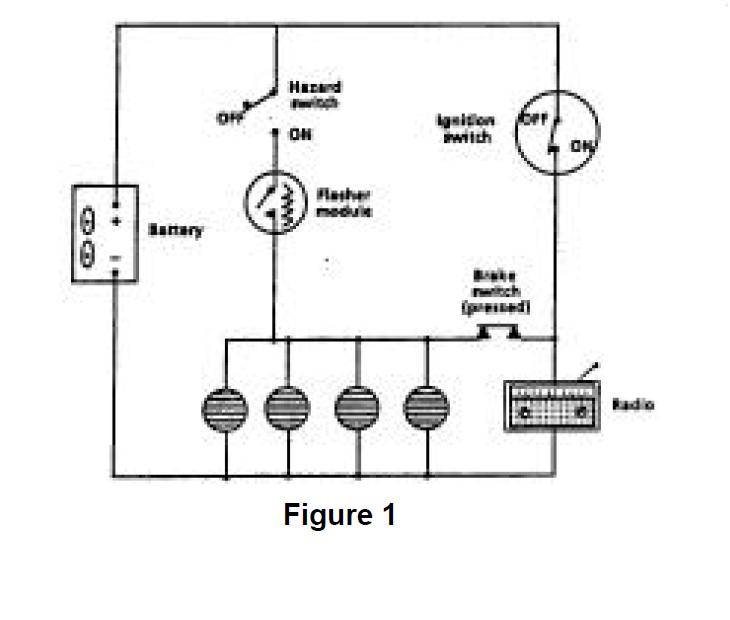
to flash. In summary, the system does what the design specification says it should do. When the design was analyzed and tested as part of the normal evaluation process, this was confirmed. Design intent had been satisfied. However, a problem remained hidden.
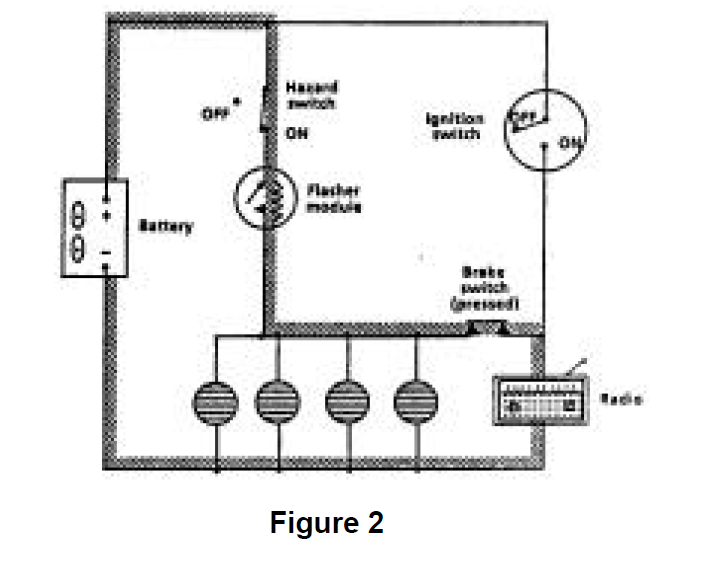
The problem with this circuit design is that the system can exhibit additional, unintended, behavior. The cause of this unintended behavior, a sneak path, is highlighted in Figure 2. This sneak condition provides a path whereby, with the ignition switch open (off), power can be supplied by the battery to the radio when the hazard switch is on. In this case, the consequences of the sneak are not severe, children left in the car by their parents could listen to the radio (in bursts) slowly draining the battery. However, the fact that the consequences of the sneak are inconsequential was due to good luck, not good design practice. Sneak Analysis specifically targets conditions like this, as well as many others, providing the kind of accurate, timely information that can serve as the basis for informed engineering/business decisions on design modification.
Sneak Analysis Automotive Experience
As mentioned, Boeing has been providing a Sneak Analysis design evaluation service to the automotive industry since 1981. The evaluation process entails supplying design information to Boeing, who performs the analysis. Analysis results, including suggested sneak-free design modifications, are then provided to the customer.
Fourteen automotive Sneak Analysis projects have been completed to date. Eighty- five sneaks have been identified and corrected. Customers include General Motors, Ford, and Volkswagen of America. Systems analyzed include: nonskid/nonlocking brake systems (both rear wheel and four wheel), microprocessor controlled electronic engine controller modules (both standalone and with integrated electronic transmissions), an airbag passenger safety system, and a whole vehicle electrical system. The frequency of occurrence of severe sneak conditions noted in Boeing's non-automotive analysis work has been observed in these automotive projects. Boeing has found that one out of every three designs analyzed, on average, contains a major sneak design problem meaning it would result in: loss of system functionality, loss of system, loss of life (operator), or major project delay because no "work around" was available until the sneak condition was corrected.
Because Sneak Analysis is often performed in parallel with the traditional design development, analysis, and test process, some fraction of the sneak conditions found by Sneak Analysis are found by the traditional techniques. In the only controlled experiment known to Boeing, the results of the Sneak Analysis were not supplied back to the project until the traditional design development, analysis, and testing were complete. Less than 40% of the sneak conditions identified by the Sneak Analysis had been discovered by the traditional approach.
Making Sneak Analysis part of the design process provides two significant cost benefits. First, it is clearly cheaper to illuminate deficiencies in paper designs than to have them discovered by prototype testing. Second, there are other cost savings associated with the avoidance of schedule elongation or schedule recovery.
The automotive design data supplied to Boeing to analyze is highly proprietary so discussion of project results must be done in a general way with a few specifics provided which are carefully masked to protect their source. The general characteristics of the designs analyzed in three projects and a results summary is provided in Figure 3. Increased detail of the Sneak Analysis process and results is provided in Section 6. SNEAK ANALYSIS APPLICATION where non-automotive project data, very similar to automotive results, is presented in greater detail.
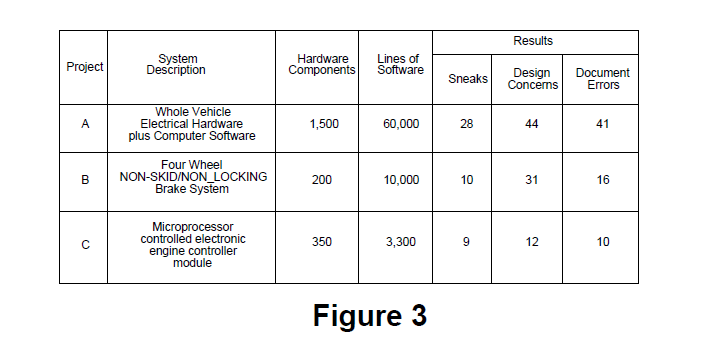
Project A represents the largest automotive system Sneak Analysis performed by Boeing. A number of prototypes had already been built of the design when Boeing was asked to perform the analysis. The timing of the analysis service was somewhat later than optimum to give the customer maximum return on investment. A number of serious sneaks were found during this analysis even though the design reflected the results of traditional analyses and there had been some feedback from prototype testing which was underway. Of the 21 sneaks found, one serious sneak condition occurred in the sophisticated monitoring/warning system that was designed to provide rapid notification to the driver if critical systems showed signs of degraded performance. The brake system was part of this functionality. Boeing determined that under certain operating conditions, a sneak condition would occur in this software that would prevent the intended incipient brake failure warning from being passed to the driver. Following notification by Boeing of the condition, the customer was able to create the triggering conditions on a prototype vehicle and confirm the occurrence of the sneak. A candid senior engineer from the customer stated that the remaining prototype vehicle test matrix contained no test conditions that would have revealed this severe problem. A simple recommended change to software removed the problem.
Project B represents Boeing's Sneak Analysis of a highly sophisticated four wheel non-skid/ nonlocking brake system. This analysis was initiated earlier during design development than in Project A. There was feeling on the customer side of the project, after project completion, that some portion of the sneak conditions identified would have been found later by the traditional techniques had the Sneak Analysis not been performed so early. Given the serious nature of the problems found on this project by Sneak Analysis, the earliest possible identification and removal of such problems minimized their impact to the project and was a wise choice. Of the ten sneaks found, four were conditions that would cause the improper disabling of the non-skid/nonlocking braking function. All of these conditions were corrected through recommended changes in computer software. As part of the Sneak Analysis process, non-sneak design problems are also identified. On this analysis one of these conditions was very serious. This was a condition wherein a single point failure in the circuitry would produce as asymmetric loss of non-skid/non-locking braking function. This problem was also eliminated fy making recommended changes to software.
Project C represents Boeing's Sneak analysis on a very mature design where the microprocessor controlled electronic engine controller module being analyzed was a design already in use in many hundreds of thousands of the customer products. As such, the chances of finding any "show stoppers" was remote. The only match for the Sneak Analysis technique in finding sneaks are the statistical odds that the hundreds of thousands of drivers operating all of those vehicles will generate conditions that will trigger sneak behavior. With the exception of one sneak condition, none of the sneak conditions and other design conditions identified were of major consequence. However, one sneak showed that an analysis on a mature design can provide valuable insight into critical operating characteristics that can have crucial impact on the long term reliability of components. In this case, the Sneak Analysis identified an engine operating condition which, although not occurring frequently, would result in raw fuel being expelled through the exhaust system into the catalytic converter. As a result of Boeing's Sneak report, the customer performed a careful analysis of the impact to catalytic converter life and was able to show that no unacceptable degradation would result. The Sneak Analysis did inform the customer of a potentially serious problem with their mature design so that adequate time would have been available to take precautionary steps if they had been required.
Technology Review
As mentioned, sneaks are latent design conditions or design flaws that have unknowingly been incorporated in electrical, software, and integrated system designs. Sneaks are not caused by component failure. The term "sneak" is an umbrella for a family of design problems that include:
• Sneak Path
Paths that can cause current, energy or logic to flow along an unexpected route resulting in unwanted functions or inhibiting a desired function. These sneak paths are not caused by component failure.
• Sneak Timing
Problems result from incompatible hardware or logic sequencing which can create unintended system behavior.
• Sneak Indications
Sneak provides false or ambiguous indication of system operating status.
• Sneak Label
Lack of accurate nomenclature or instructions on controls or displays that can lead to erroneous operator actions.
Historically, Boeing has found three principle causes of sneak conditions: (1) system complexity - highly complex systems are more sneak prone (2) organizational complexity - a large complex design development organization, frequently involving subcontractors, is ripe for creating sneaks, especially due to difficulty in accurately defining the interfaces; (3) rapid change in technology -the time available to analyze and test new systems prior to product introduction is being compressed, creating sneaks.
Whether being performed as part of a design evaluation service or a technology resident on a Workstation, the fundamentals of the Sneak Analysis process are the same. Sneak Analysis restructures design data into its constitutive functional building blocks, referred to as network trees, which are meticulously checked for the presence of sneaks. System IeveI, and hardware/ software integration functionality are reviewed by evaluating assemblages of related functional blocks, called network forests, for sneak conditions. Thus, Sneak Analysis evaluates a design at multiple levels of detail searching for sneak conditions. Sneak Analysis is effective, to a great degree, because it is a highly structured, carefully organized, process which proceeds, whether being performed manually or on a Workstation, following a systematic rule-based approach.
Sneak Analysis does not rely on simulation to detect sneaks. Unlike most evaluation approaches, including testing, it does not use input to output checking, where the outputs of a system are evaluated based upon a series of prescribed inputs. Input to output checking approaches are valuable, but 'they "choke" computationally on complex systems because of the vast number of parametric combinations that must be considered to completely evaluate the system. The Sneak Analysis approach is unique because it starts at an output and works backward to see what inputs (static or dynamic), if any, could cause that output to assume a sneak value. With Sneak Analysis only a small fraction of the functional outputs present in the design need to be checked in detail. Those needing checking are determined through a careful rule-based process involving over 250 different checks. The rules are a composite of historical information collected on weaknesses in hardware and software design logic coupled with rules reflecting state-of-the-art technology compatibility issues. Continuing emphasis is placed on keeping these rules up-to-date.
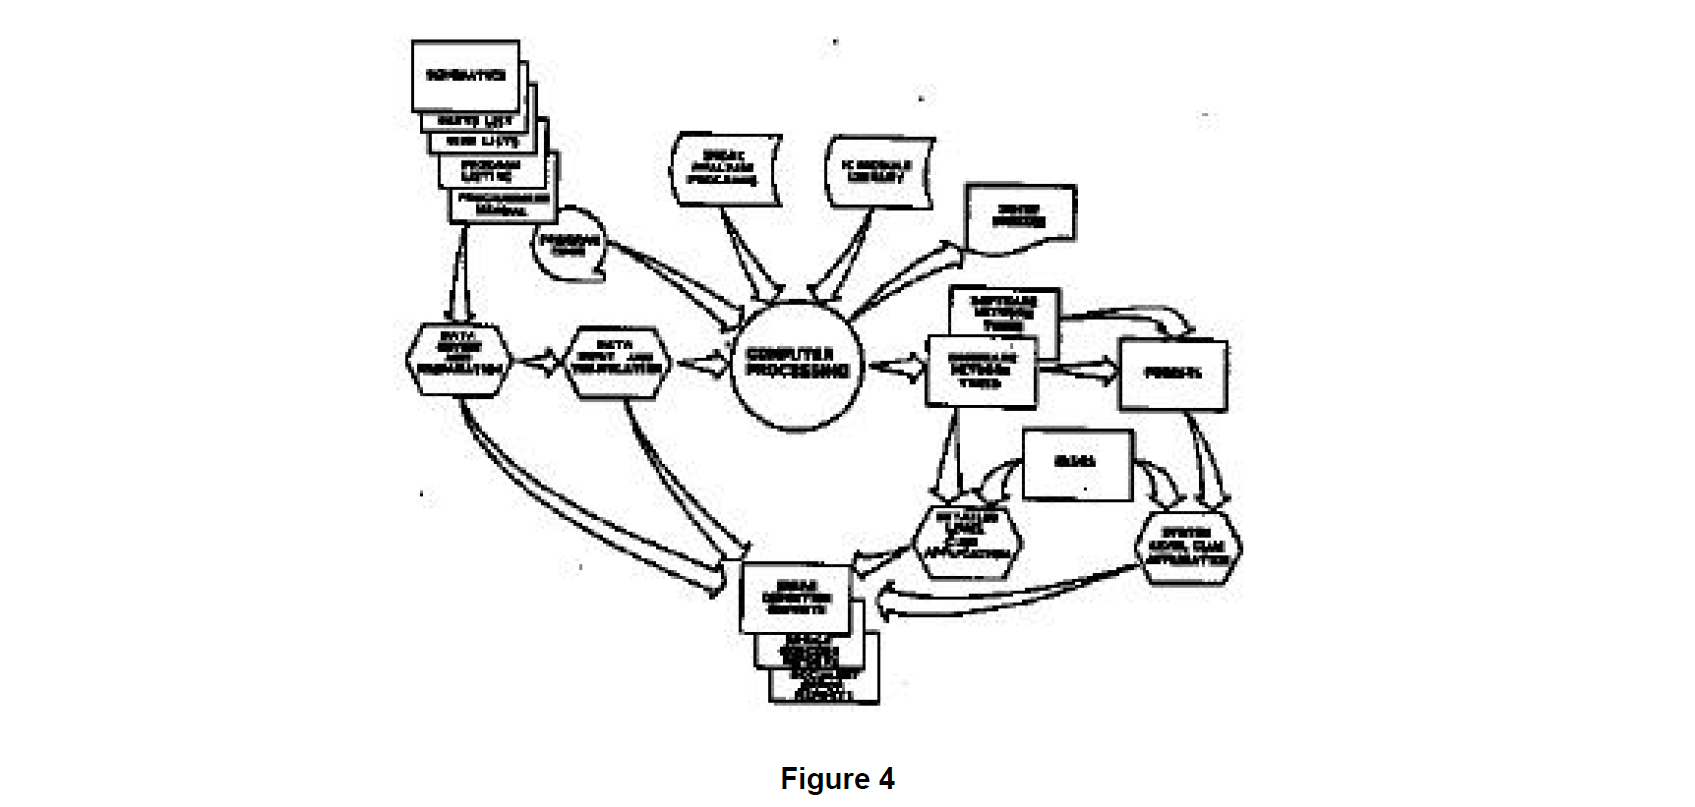
The specifics of how these procedures are implemented vary whether considering the batch supported sneak evaluation service or the new Workstation development. The principal functions making up the sneak evaluation process are shown in Figure 4.
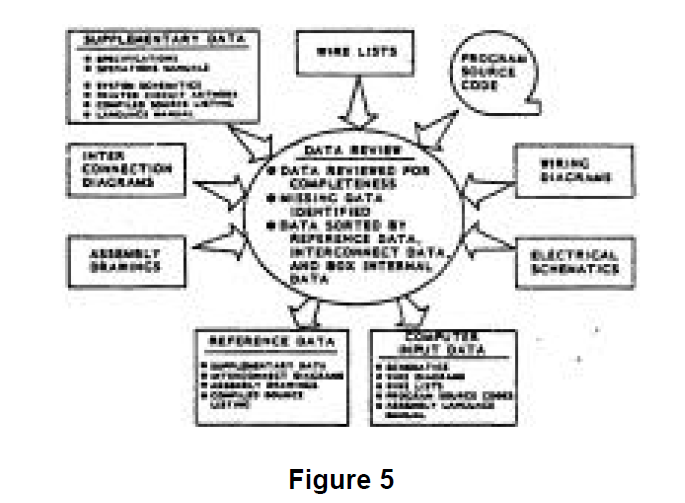
The Sneak Analysis process begins with the encoding of the design data into the host computer so that resident Sneak Analysis software can perform its tasks. The design data, whether it be hardware, software, or both, is first evaluated for completeness. Hardware data can be supplied either in hardcopy form or electronically transferred from an electrical computer aided design (ECAD) system. Computer software design data is normally entered directly off of magnetic tape or disk. Data is grouped into two categories: (1) reference data, or (2) computer input data. Reference data includes such items as assembly drawings, language description manuals, assembled program hardcopy listings, and operation manuals. The data review is described in Figure 5. Data needed for input to the computer defines the system design to the component/instruction level.
Hardware and software data are normally not in a form ideal for direct translation into network trees since they are set up for the design process. Multiple functions are typically present on the hardware schematic, as well as within each software routine developed during the design process. However, detailed Sneak Analysis requires that multiple functions be separated from one another. Therefore, the system data are partitioned into functional elements. This partitioning process is based on system functions and subfunctions in the hardware and software.
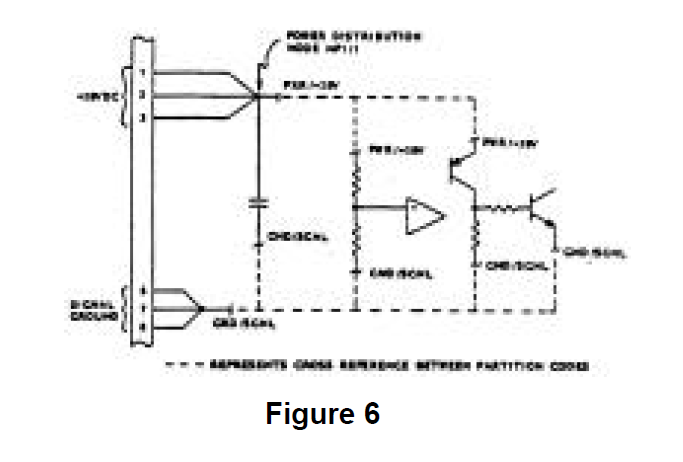
In the hardware design data, the system functions are tied together through the hardwired connectivity, of which there are two major categories: power distribution and signal distribution. Power and return functions are partitioned from signal functions. This is accomplished by replacing the hard-wired connectivity between these two functional areas with unique partition codes. These codes are used during computer processing to maintain system connectivity via computer-generated cross references. Figure 6 shows a power and ground partitioning example.
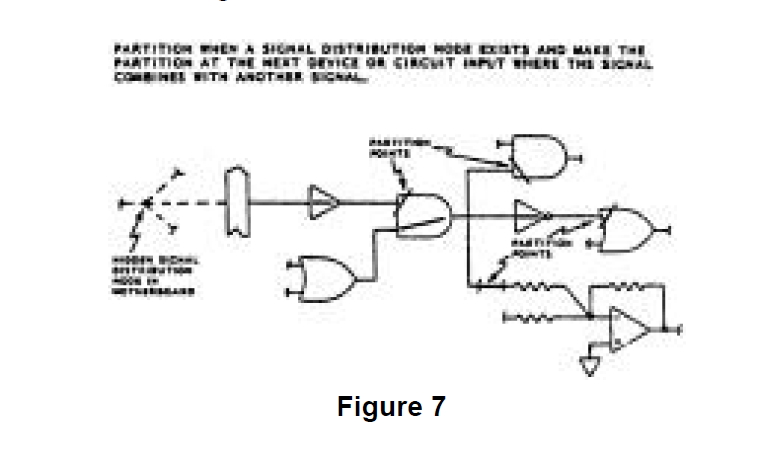
The signal functions that flow between the inputs and outputs are partitioned to eliminate the confusion of cross-combined functional paths that exist in the designoriented data. Some of these functions are general control functions such as power-onreset. These signaIs are mixed throughout the design-oriented data, not only with other control signals, but with circuitry that actually performs the critical functions. The system output functions depend on the control functions but are functionally separate entities. Therefore, they are partitioned from the control functions. Years of experience and study by Boeing have led to the development of concise partitioning rules. The application of these rules has been automated for the most common types of circuitry. This automated partitioning process, unique to Boeing, optimizes network tree construction since the computer algorithms can search out complete functional paths accurately and quickly. An example of signal partitioning is shown in Figure 7.
Software partitioning is based on system functions and subfunctions within the software. Sneak Analysis requires a functional and graphical layout of the software code. The first step in functionally restructuring the software data is to partition the functional parts of the program from one another. This partitioning is accomplished by first identifying the beginning of each subroutine. Complex subroutines require further partitioning into various subfunctions. This is accomplished by identifying programmer generated labels that are referenced within the subroutine and designating these labels as additional partition points. These partition points are then flagged on the computer listing.
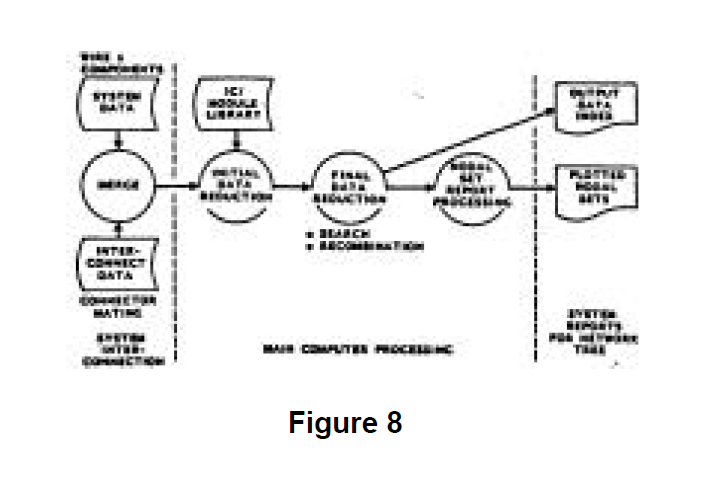
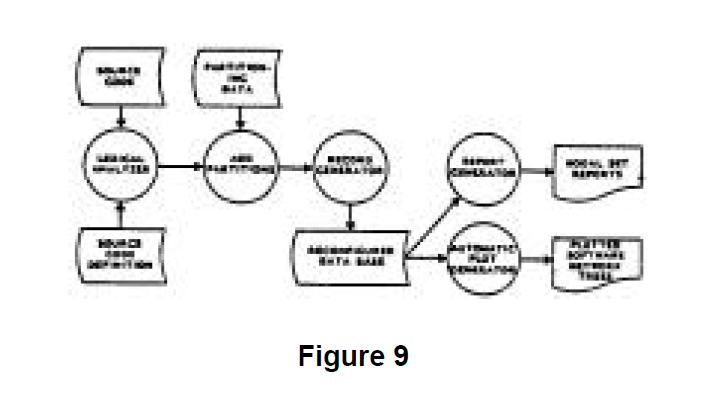
For the batch mode Sneak Analysis evaluation process, the hardware and software computer processing proceed as shown in Figures 8 and 9 respectively.
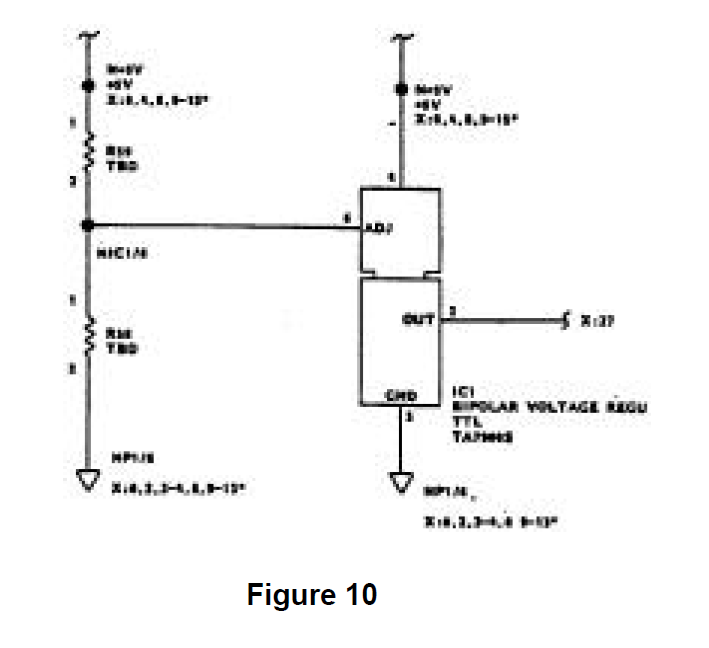
Each hardware network tree is plotted in a topological manner, which means that with respect to a node, current flow is top to bottom and signal flow is left to right. Typically, each hardware network tree has a single output. All contributing inputs which may affect that output are shown on that tree. A sample hardware network tree is shown in Figure 10.
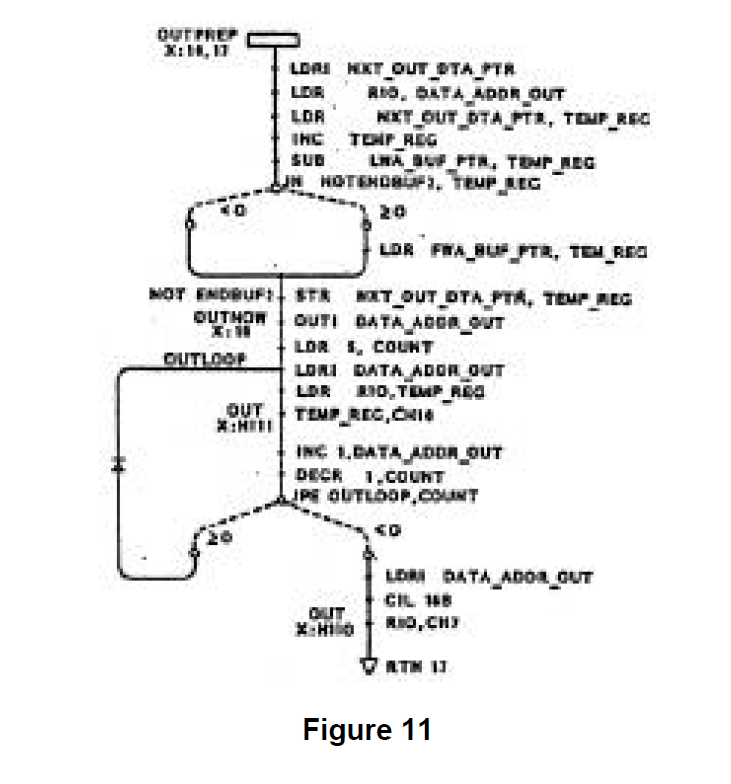
The software network trees are plotted by replacing the sequential assembly language listings with corresponding topological patterns. Each software network tree shows all logic paths and instructions for a given section of software code. Each network tree in which a variable is referenced contains a cross-reference to the network tree where that variable is defined. Cross-references between labels and their references and between subroutines and their calls are automatically generated and printed on the network trees so that program flow is easily traced. Decision points are clearly shown. These software trees are integrated with one another and with the hardware network trees through the use of network forests. A sample software network tree is shown in Figure 11.
System-level outputs are the principle functional products at the analysis boundary typically involving multiple network trees to encompass their functionality. Each network tree which represents a system output becomes the output of a network forest. The forest establishes the functional connectivity between the system output and all of the related inputs. The forest is constructed by matching the computergenerated cross-references for each hardware and software network tree. These cross-references relate the inputs of a given network tree to the outputs of other network trees. Thus, each forest becomes a diagram of functionally related network trees that defines s system output in terms of all of its controlling inputs.
A list of system outputs and their network trees is prepared. Each of these functions is then assigned to an analyst. The analyst identifies the hardware and software network trees which provide inputs to the base network tree using the computer-generated cross-references. The cross-referencing process continues until a system input which has no cross-references is reached, or until an output which is also an input to other system functions not directly related to the function being examined is reached. This cross-referencing also occurs across the hardware/software interface, which integrates the hardware and software network trees into a single network forest. The integration is accomplished by converting the hardware address at the interface to the corresponding software variable which represents that hardware address. This software variable is then located on a specific software network tree, which has inputs (other variables and constants) that are outputs from other software network trees. These network trees are identified by cross references on the software network trees. These software network trees, in turn, eventually lead to inputs from other hardware network trees. Thus, hardware and software network trees are integrated by the network forest.
The final phase of Sneak Analysis is the application of checks, clues, to the topological network trees and forests. The presence of a clue in design data directs the analyst to ask a set of specific questions.
The current list of sneak clues developed by Boeing is the result of 20 years of research and experience on numerous types of hardware and software systems. The application of sneak clues is performed without limitations as to the intended sequence of inputs. This principle makes Sneak Analysis unique from simulations or walkthroughs, since the unexpected combinations or sequences of in puts make sneak conditions difficult to uncover by other means.
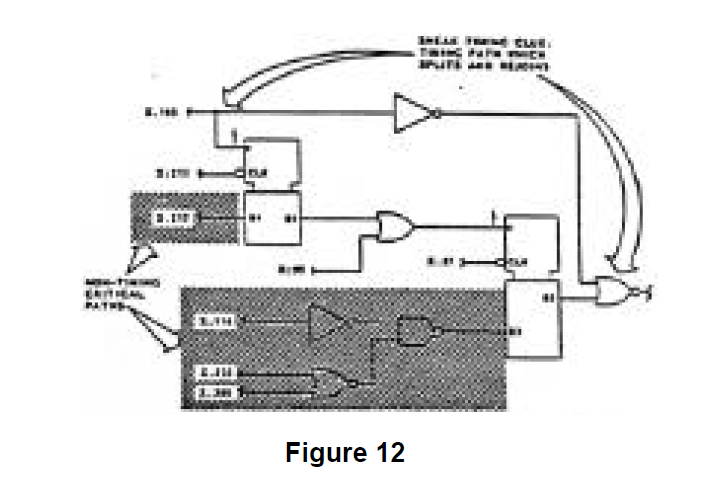
If a clue indicates the possibility of a sneak condition, other analyses are used to try to disprove the occurrence of the sneak condition. This is accomplished by tracking through the network trees from the output to the inputs and searching for the combination of inputs that would cause the suspected sneak condition. The application of a particular clue also results in elimination of some of the inputs form consideration as illustrated by Figure 12. When the occurrence of the sneak condition depends on critical timing or worst-case parameters, simulation or parametric analyses are employed. In performing these other analyses, care is taken not to preclude or limit any affects on the subfunction being analyzed. In other works, the probability of a set of inputs occurring maybe very low, but if it could not be disproven, then a sneak condition exists and is reported. This input combination can be the result of either normal or abnormal operating conditions. Therefore, the Sneak Analysis is not limited to normal operating procedures or conditions. Rather, the set of input combinations that can cause a sneak condition is determined after the potential sneak condition is identified by the sneak clue.
Most importantly, in a normal analysis, the great majority of the design data will not contain clue matches. These unmatched areas of the design then do not require additional analysis attention permitting the analysis process to focus on the small subset that remains.
The sneak clues, complete with detailed explanations, form a section of the Sneak Analysis Handbook which is issued to each sneak analyst. For ease of application, the clues are classified into categories which relate to visual keys on the network trees. Sneak clue category checklists have been developed which index the visual keys to specific examples and questions.
The sneak clues are applied at three levels during the clue application phase. The first two levels are applied to individual network trees within a forest. The third is applied to the forests.
First, clues are applied at the electrical current flow level for hardware trees and the program flow level for software trees. This level of clue application results in finding classical conditions such as unintended reverse current flows, overstress of components, infinite software program loops, and software code which could not be executed.
The second level of clue application is functional clue application at the individual hardware of software network tree level. This second level application of system clues results in locating signal/data flow problems and timing conflicts on a localized basis.
The third level of clue application occurs at the network forest or system level. The forests provide a system level view of the relationships between the various signals and variables which relate to a system output. However, no paths are omitted as they are in typical system level block diagrams. Therefore, clue application to the forests provide insight into complex system relationships including hardware/software interactions which could not be seen clearly through other means.
During this phase, the analysts meet frequently to consolidate system knowledge. The analysis of software involves following both signal flows and logic flows. The analysts encounter some logic flow paths which are contained in multiple forests. Through these meetings, the forests are updated and revised to reflect actual signal flow through the software.
The product of the analysis process is a series of reports documenting the findings of the analysis.
Technology Growth - The Future
Boeing's experience with Sneak Analysis over the last 22 years has provided four useful lessons and insights.
Sneak analysis is a proven, effective, powerful technology for improving product quality in automotive systems.
A tremendous growth in the technologies usefulness and broadened application is possible if:
- The time required for analysis can be significantly reduced.
- The cost per analysis can be significantly reduced.
- The ability to bring the technology "in-house" existed for large users.Major improvements are possible to improve how the technology can be applied to the evaluation of a design - recent workstations and artificial intelligence (AI) technology advances make creation of a Sneak Analysis workstation possible.
Most critically, the full measure of the productivity potential of a workstation version of Sneak Analysis can only be achieved through its thoughtful integration into the user's design development and analysis process.
As a result, Boeing has moved forward to create the Sneak Analysis Workstation. The first major step in this process, creation of the Prototype Sneak Analysis Workstation is complete, functional, employed on commercial work, and is being demonstrated to automotive companies. The Prototype is an end-to-end implementation of the electrical hardware analysis portion of the Sneak Analysis process. The Prototype successfully demonstrates that all of the major Workstation development challenges are achievable. The Prototype experience strongly reaffirms the requirement for a clear definition of the user and the user's requirements prior to moving ahead with development of the Sneak Analysis Workstation functional specification and detail design.
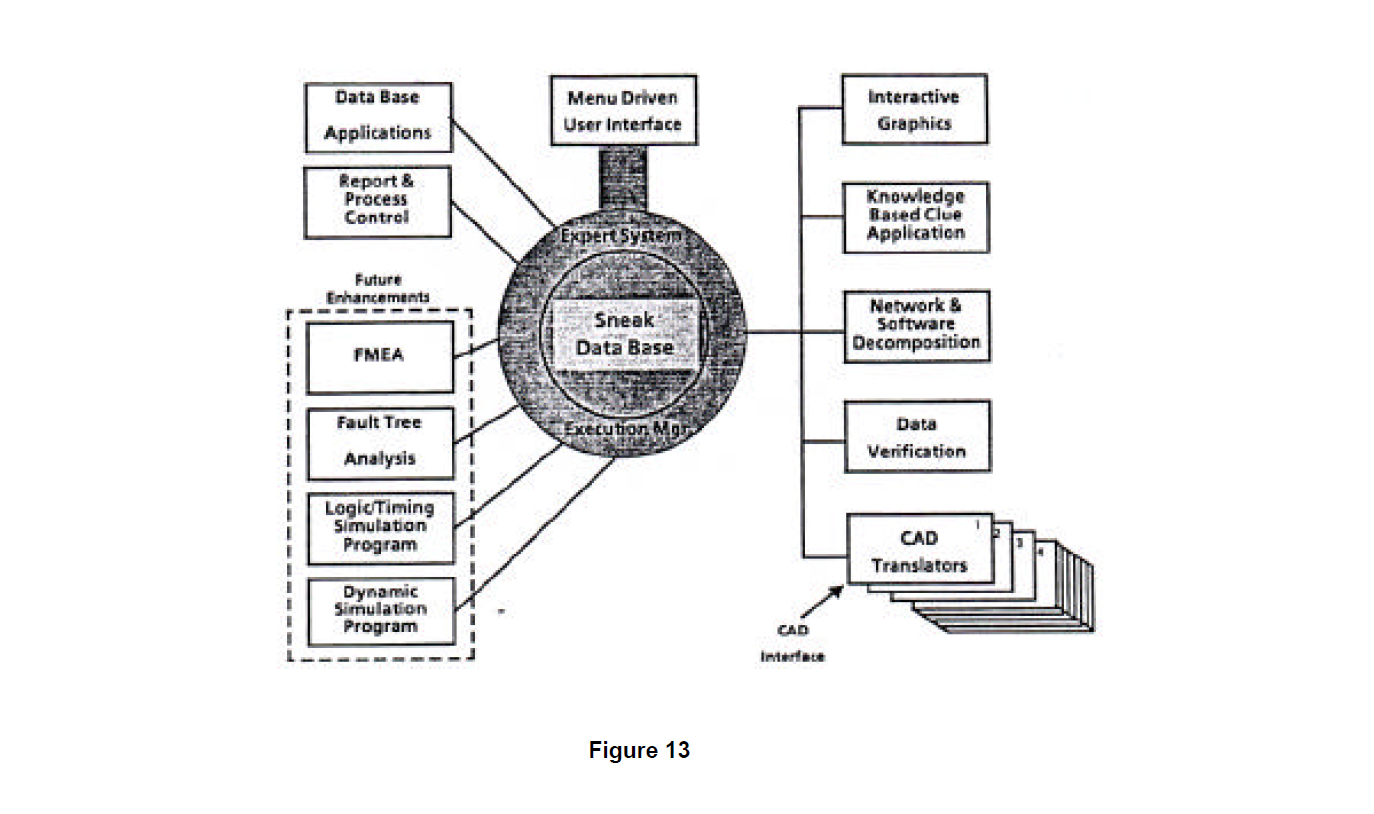
The Prototype has achieved productivity improvements of between 3 and 7 over the processes that it is replacing. Also, the ability of the Workstation to systematically and unrelentingly apply the rules, that are at the heart of the Sneak process, has been confirmed. This produces an even more powerful analysis than presently available with even fewer errors that exist when human analysts are performing the work. The Workstation also will make available the ability to quickly incorporate changes in design because of the efficient data load features. Given the data base management approach being used, the foundation is created to launch additional reliability analyses. In the future, the Workstation will be able to host fault tree analysis, failure mode and effects analysis, and digital logic simulation analysis in addition to Sneak Analysis because of its ability to retrieve, manipulate, and store data. These features and functionality are depicted in Figure 13 and described below.
Workstation Hardware
Sneak Analysis Workstation software will support individual workstations working alone or in rings where data sharing will be possible. The capability required by the Workstation hardware is equal to or greater that the Prototype Apollo DN3000. The memory and storage requirements are not as yet defined, although the Prototype requires 8 megabytes of memory and 35 megabytes of available disk space. Designs one and a half times the complexity of Project B in Table 1 and greater will be analyzable on such a platform. If complexity should grow by an order of magnitude or more, consideration may be given to establishing a link to a supercomputer for processing. This is not considered likely given the dramatic improvements in workstation performance.
Workstation Software
Sneak Analysis Workstation software will be highly portable. UNIX will be the operating system with a possibility of a requirement for a VMS version. Nearly all of the software will be written in "6". We will minimize dependence on proprietary software to reduce potential long term support problems.
Expert System User Interface
Boeing is a leader in the use of expert systems as the interface between the user and application software. For the Sneak Analysis Workstation this makes good sense because such an approach will provide both a very friendly interface and, more importantly, it will be a flexible interface that will be easily adapted to meet evolving interface requirements. As part of this interface, a functionality that has been labeled the "Big Brother Function" will be implemented to ensure that all required steps are performed correctly and in sequence for a rigorous Sneak Analysis. Record keeping of the process as performed will be maintained to support Quality Assurance procedures that have proven to be so important to the accuracy of Sneak evaluation service.
Efficient Management of Data
The value of a data base manager was clearly demonstrated on the Prototype Workstation. As the size of the problems increases and the uses of the data expand, the requirement for a state-of-the-art data base manager 5 reinforced.
Data Input
Data translators will permit the direct loading electrical CAD (ECAD) data into the Workstation. An enhanced version of the man u a I hardware data entry process developed for the Prototype will be available as backup and to support entry of the small amount of design data required for the analysis which is not yet standardly available from most ECAD systems. Software design data will be read in directly from tape or disk. A series of data validation checks will be performed coincidentally with the data entry process and the user will be informed immediately of the nature of any problem encountered.
Graphics output will be used to confirm that the process is working correctly, permit interaction between the user and the data, and support the interpretation of the results of the analysis. The functional representations of the design data, network trees and forests, will be displayed graphically. A powerful full screen editor will permit the user to modify the arrangement of the screen image to suit individual preferences. The presence of potential sneak conditions in the design will be clearly identified through text and graphical display to permit accurate interpretation of analysis results.
Artificial Intelligence (AI) Clue Application
The evaluation of the functionalized design data for the presence of sneaks will employ an Al rule-based approach. There are approximately 250 specific types of checks that are presently applied as part of the Sneak Analysis evaluation service. This checking process will be captured with an Al system resulting in a dramatic improvement in productivity; in the evaluation service this checking process consumes between 45% (hardware only) and 70% (software only) of the total Sneak Analysis effort.
Sneak Analysis Application
To better understand the Sneak Analysis process, an aerospace example that is in the public domain will be examined in greater detail. The system being evaluated is designated the F-99 Weapon Control System (WCS). This system directs the release of a weapon by firing an electroexplosive device called a squib. Interestingly, deployment of the inflatable bag used in automotive personal restraint systems employs a similar use of a squib, The F-99 WCS example is hardware only and provides an excellent demonstration of how the process works on a system of moderate complexity. As is typically the case, this design had already passed through the traditional analysis and test procedures and had been found to pergorm all of the tasks requested of it in the system specification. But of course, having been selected as an example, this system does a who;e lot more. For the discussion we will examine five areas of the Sneak Analysis process:
- Design data review
- Partitioning of design data creating functional building blocks (network trees)
- Evaluation of network trees for presence of sneak clues
- Focused analysis of network trees that do contain sneak clues to prove or disprove the presence of sneak conditions
- °Identification of sneak-free design modifications
To keep this discussion manageable, only a small subset of the design data required to completely define the F-99 W65 is included. These design data: one cable diagram, one panel layout, one block diagram, and two schematics, are provided to show an overview of the WCS's functionality and provide some specific information on an area of the design, the weapon controller power distribution function, where a sneak condition will be identified and corrected.
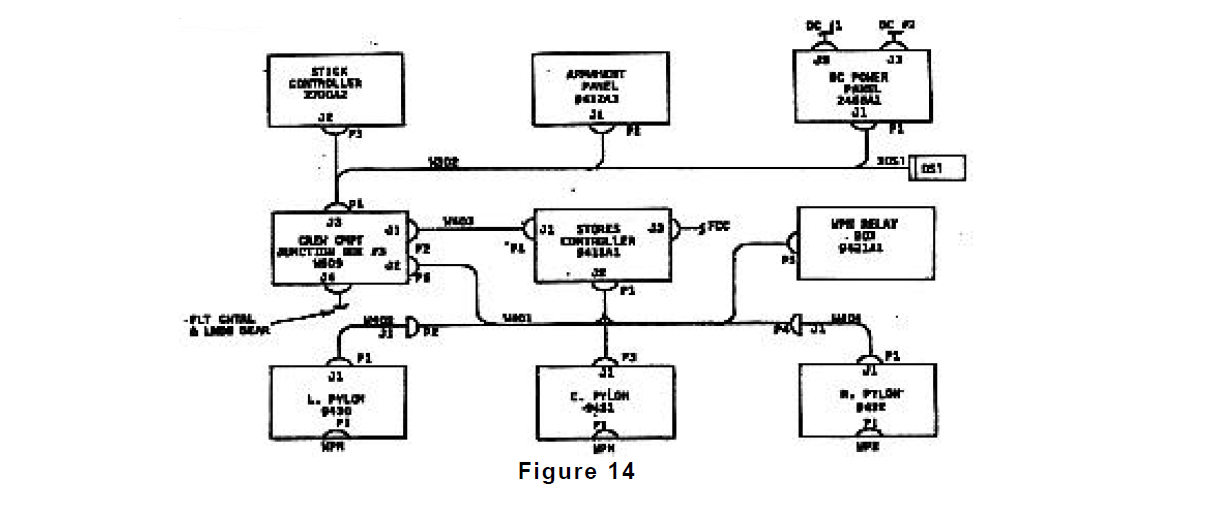
An overview of the design being sneak analyzed is provided by Figure 14, a cable diagram for the F99 WCS system. The scope of the Sneak Analysis included all of the areas shown in this figure except the left and right pylon data. The left and right pylon are identical electrically to the center pylon and were therefore not included in the analysis to reduce complexity. Figure 14 provides overall connectivity information between the principle boxes that make up the system. The numbers present in each box are referred to as Reference Designators (abbreviated to Ref. Des.) and are used to locate oneself in the design.
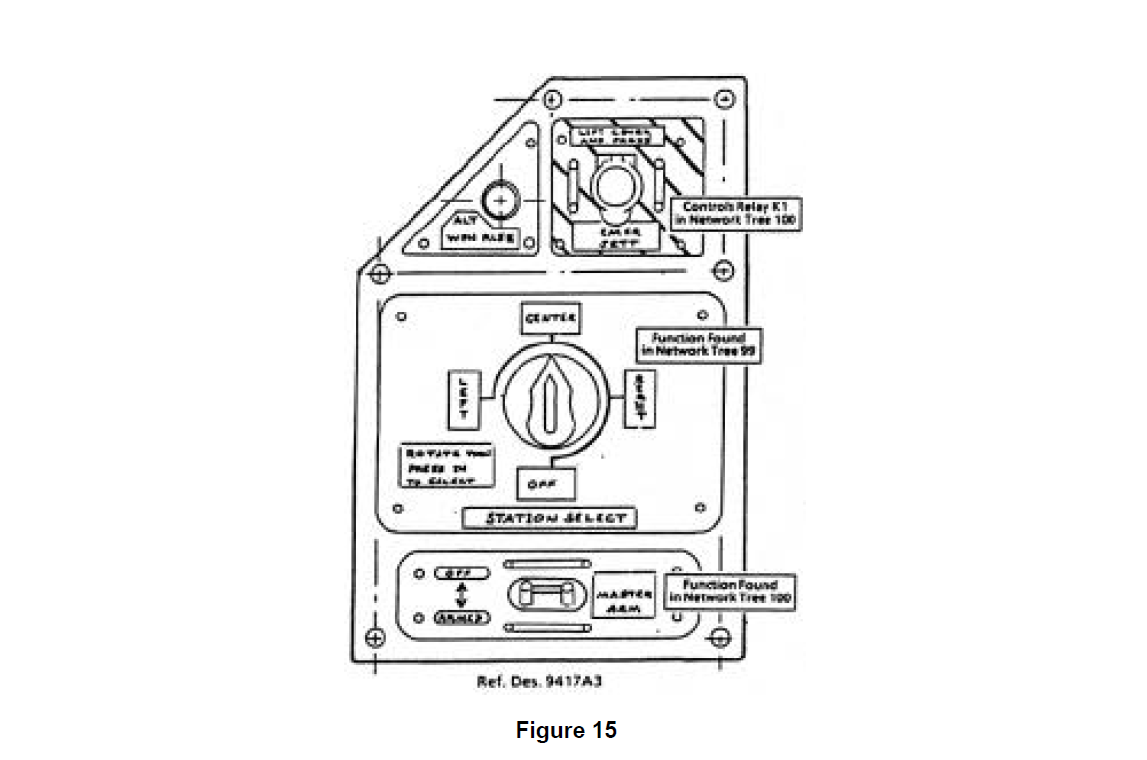
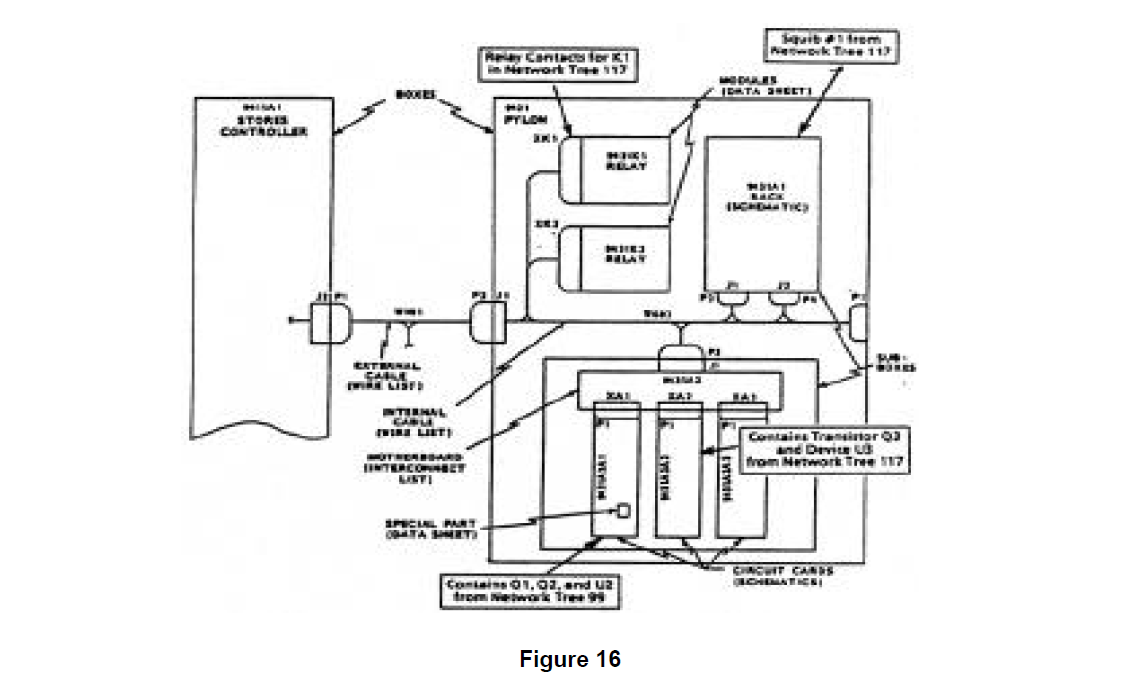
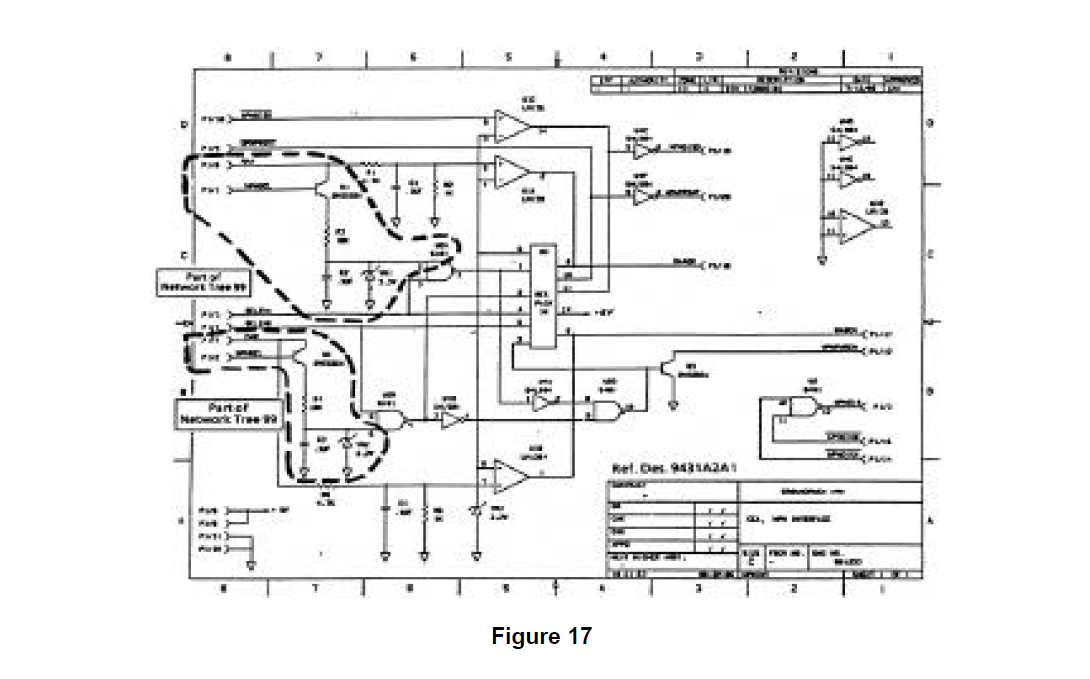
Notes are included on Figures 14 through 18 which show where the partitioning process has extracted data relating to particular functions. This extracted data is then assembled to form functionally oriented network trees. In all of these design documents, data is grouped based upon physical location rather than functional orientation.
The physical nature of the design data is clearly shown in Figure 15 which presents the layout of the Armament Panel (Ref. Des. 9417A3). Here the control interface between the operator and the weapon control function is seen. Contained here are the controls for arming (providing power to) the system, selecting which pylon’s weapon will be released, energizing the weapons release in an emergency, and providing an alternative release of the weapon. each of these modes of control later show up on separate network trees.
Additional critical design data relating to the F-99 WCS power distribution function is contained in Figure 16 which is a block diagram showing the contents of the Center Pylon Box (Ref, Des 9431) and its connection to the Stores Controller Box (Ref. Des, 9411A1). Figure 16 defines the connectivity and substructure of the design elements contained in the center pylon. The schematics for two of the circuit cards (Ref. Des. 9431A2A1 and 9431A2A1) contained in the lower sub box are shown in Figures 17 and 18.
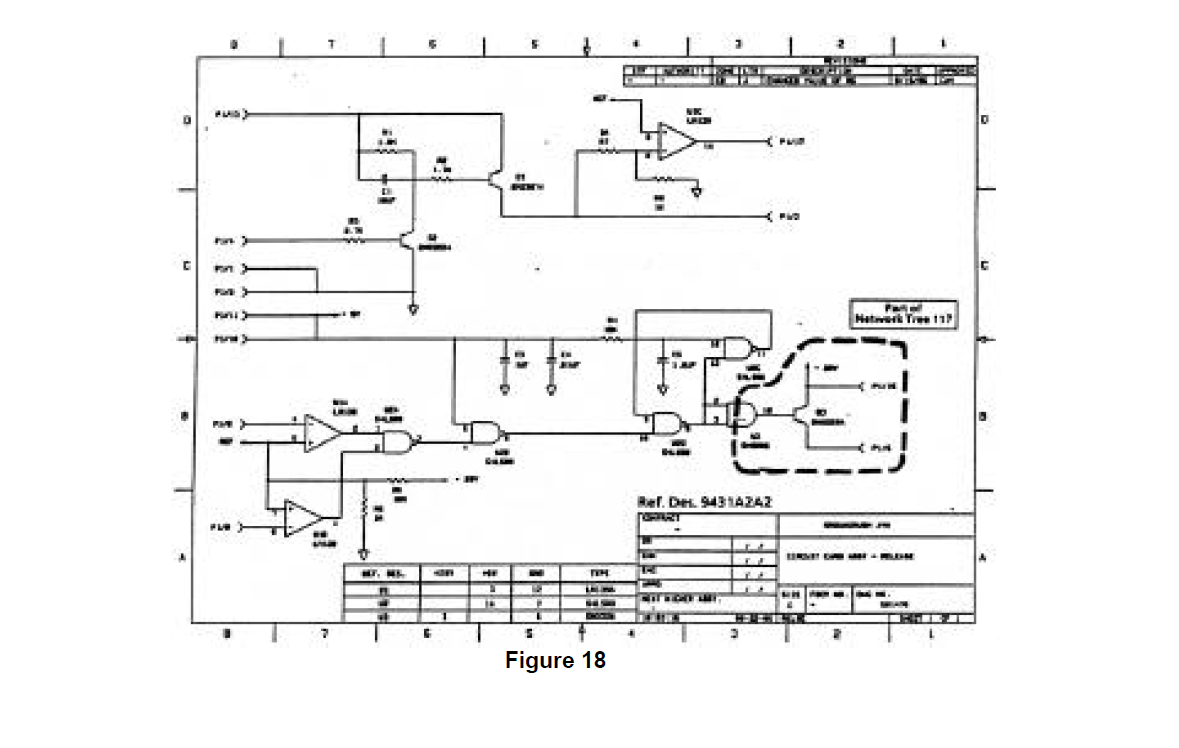
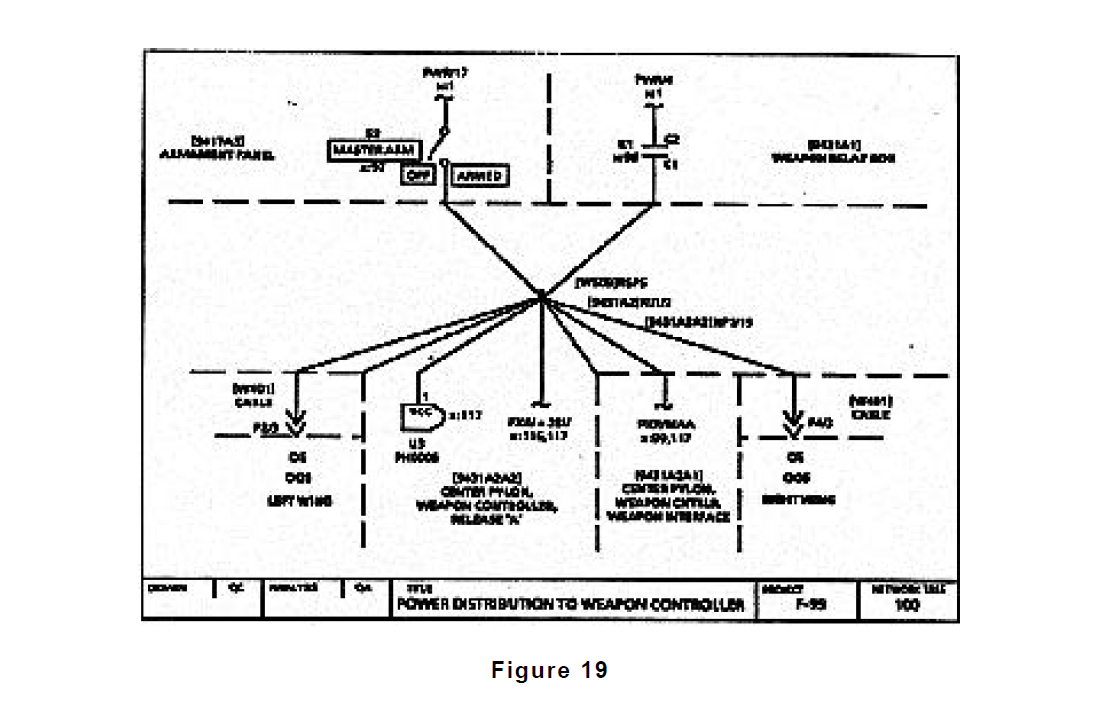
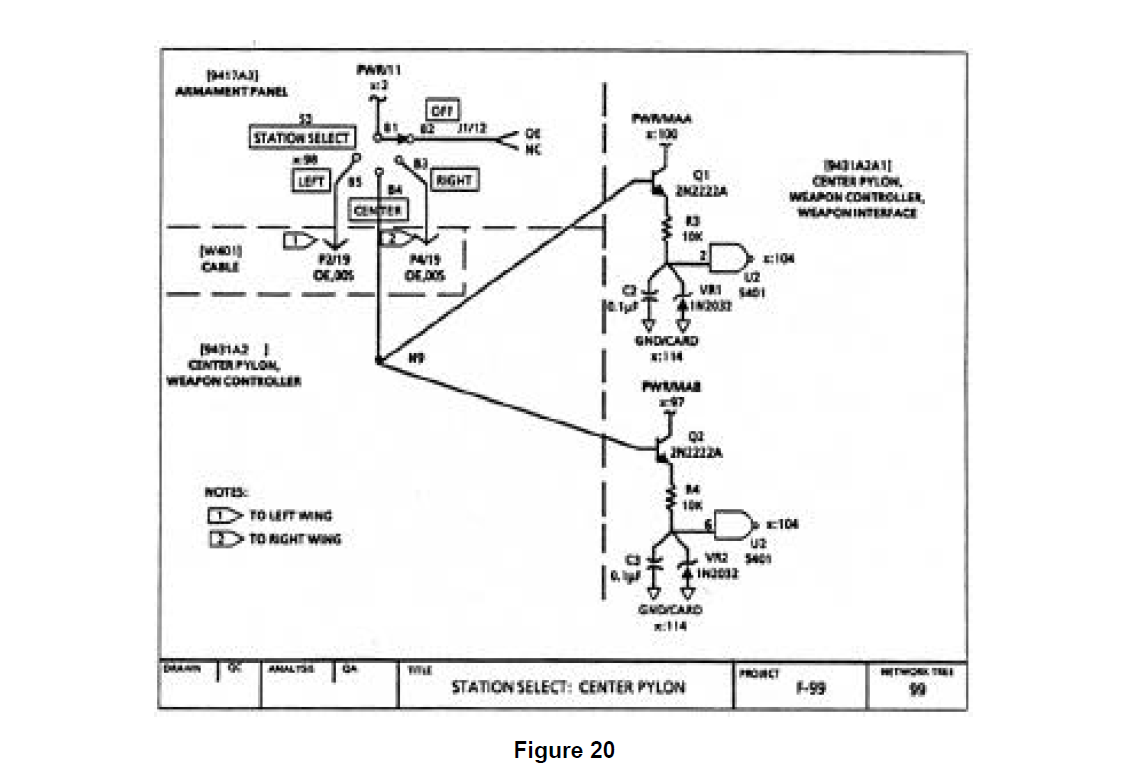
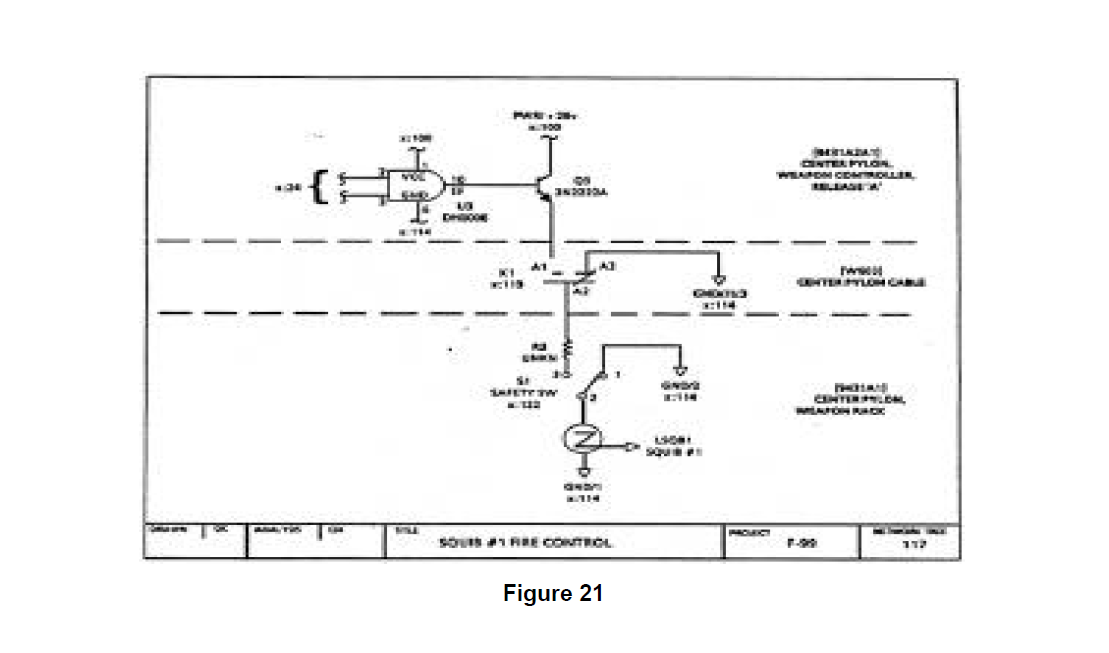
Given a complete set of F-99 'WCS design documentation, of which Figures 14 through 18 represent only a small part, the partitioning process was performed as described in Section -0 TECHNOLOGY REVIEW. The partitioning of thIs data produced 195 network trees representing the functional details of the design. Most of these network trees contain design information drawn from multiple schematics and other design sources (as documented in the notes found on the figures). These network trees demonstrate the rigor and analytic strength of the partitioning process, going across physical boundaries to identify and group together functionally related areas of the design. Figures 19, 20, and 21 show network trees generated by the F-99 WCS partitioning that are related to the weapon controller power distribution function.
For this discussion, focus will be maintained on network tree 100 (Figure 19) and its related network trees (through cross references) 99 and 117 (Figures 20 and 21). All of the 195 network trees were carefully screened for the 250 clues contained in the master sneak clue list. An interesting sneak clue match is present in network tree 100 which draws the analyst's attention. This generates specific follow up checking of network tree 100 that must be performed to prove or disprove the presence of a sneak condition. Other clue matches were identified but will not be evaluated here.
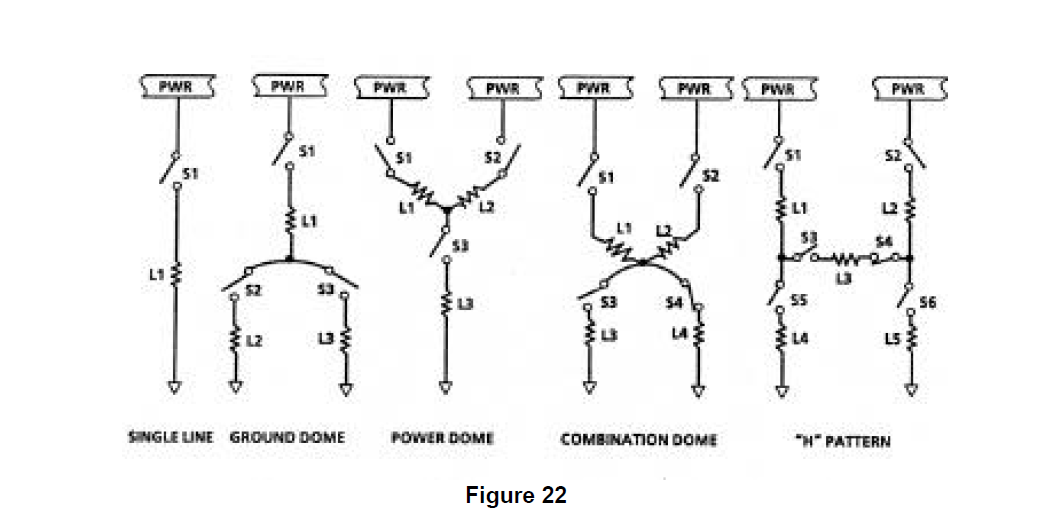
One of the "classic" topographical sneak clues, the "combination dome", is matched in network tree 100. Shown in Figure 22 with four other "classic" topographical clues, topographical clues were thought, up until the mid 1970's, to be the only form that sneak clues could take. The growth in the number of clues employed by Boeing to approximately o
The details of checking the network trees for issues (1) and (2) will not be reviewed because no problems were identified by this process. However, a careful evaluation of network tree 100 and related trees for the presence of alternate power sources in the "ground dome" did identify a possible source which could cause the unintended supply of power to the distribution node under certain conditions.
The checking of network tree 100 is done assuming that the master arm switch and the weapon relay are both open, meaning that no power can be supplied to the distribution node as normally intended. To determine if power is available from the "ground dome" requires a careful investigation of the referenced network trees identified on network tree 100. To shorten a lengthy checking process, let the checking move immediately to cross referenced tree 99 (Figure 20) to see if it contains any alternate power sources. Network tree 99 contains access to two Separate power sources, besides that in network tree 100, identified through cross references to network tree 2 (PWR/1 1, referenced in the upper left of network tree 99) and a master arm power source B cross referenced in network tree 97 (PWR/MAB, referenced in the middle of network tree 99).
First, checking the possibility of power being supplied to network tree 100 through network tree 99 from network tree 2. It can be seen that this is possible if the station select switch on the Armament Panel is set in the "center" position 28 volt power will be supplied across the switch to node N9. Next, the characteristics of the transistor, device Q1 in network tree 99, need to be evaluated to determine if the presence of 28 volts at the base of Q1 will result in power being supplied to network tree 100 across the transistor collector. A careful check of the effects of the components present between the emitter of Q1 and ground confirms that the presence of 28 volts at the base of Q1 will in fact result in power being supplied to the distribution node in network tree 100 via the base to collector path.
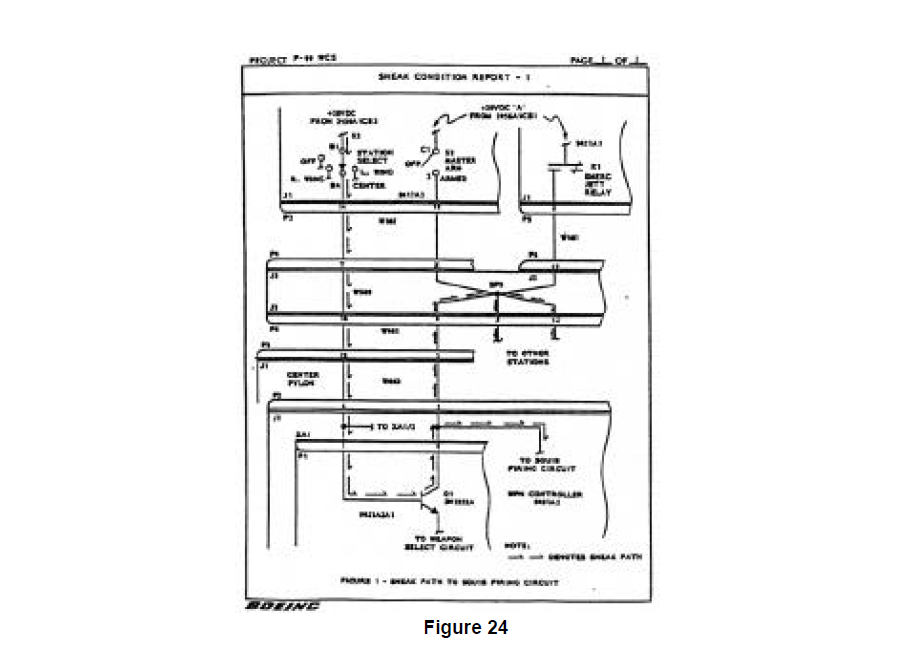
The consequence of power being supplied to the distribution node in network tree 100 in this fashion can be severe as seen by examining network tree 117 (Figure 21). This shows that if the relay 9431 K1 is closed and the safety switch 51 is closed, as is always the case for this system when operating, power can be supplied to squib 1 resulting in an unintended detonation. Thus, the consequences of this sneak condition warrant its correction.
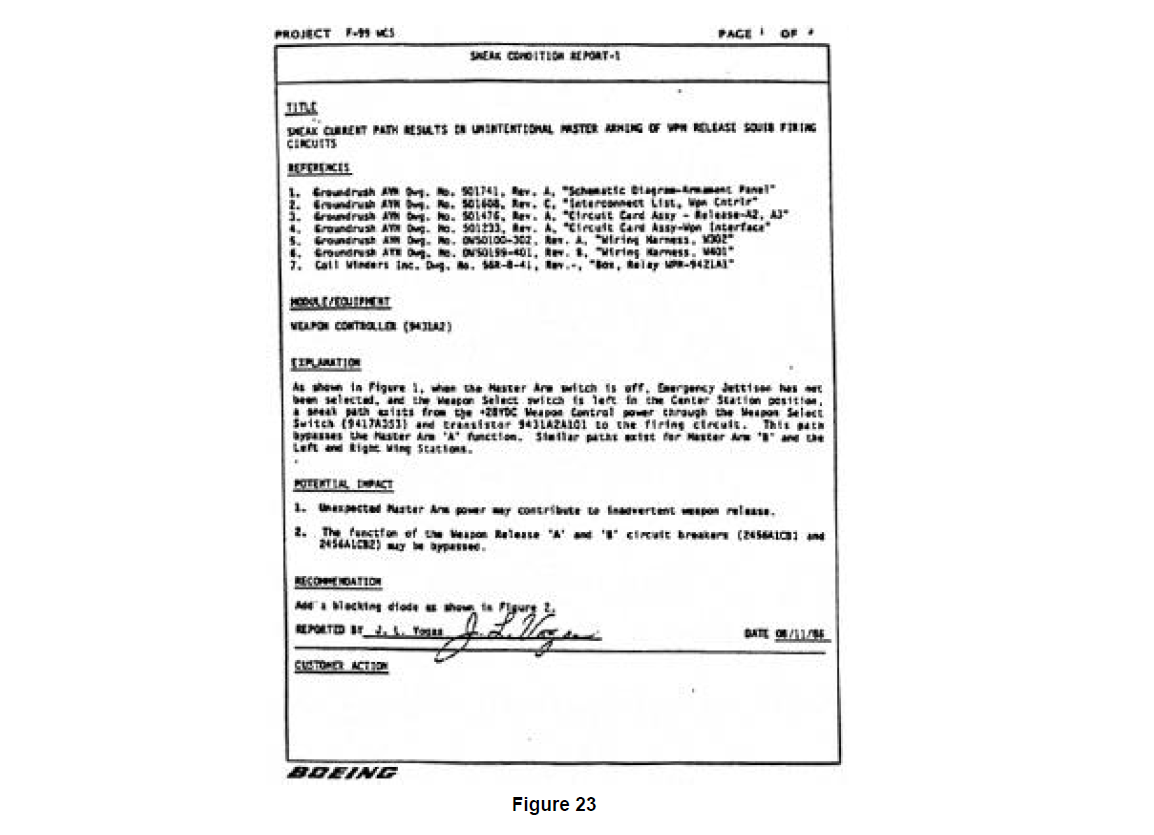
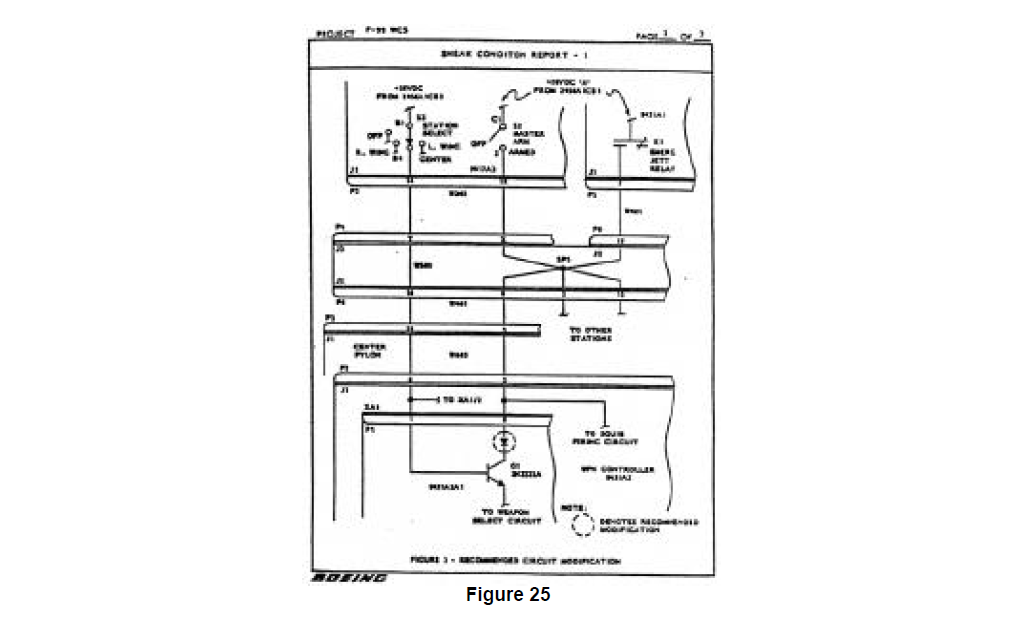
Documentation of this sneak condition and a possible correction are supplied by Boeing. A Sneak Condition Report is prepared describing the basis of the analysis, what was found, impact to system operation (Figures 23 and 24) and most critically one suggestion for a sneak-free correction (Figure 25).
