By: James L. Vogas, Boeing Aerospace Operations, Inc. • Houston, Texas
Keywords: Sneak Analysis, Simulation, Netowrk Trees, Forests, Sneak Condition
Summary & Conclusions
Sneak Analysis complements simulation and testing by uncovering problems that may not be otherwise detected. Sneak Analysis does not predict system behavior for component failures or specific operational scenarios and, therefore, is not a replacement for simulation and testing. Simulation can be used to better understand the impact of conditions uncovered by Sneak Analysis and to evaluate fixes. Sneak Analysis can reduce schedule risks and costs by detecting errors before fabrication. Detection of potential operational problems through Sneak Analysis, including those which might appear as intermittent failures, can reduce operating costs and improve dispatch reliability. The detailed topological diagrams produced during Sneak Analysis are also useful for other analyses, evaluating design changes, and test planning and troubleshooting.
Introduction
Unexpected behavior of systems is of increasing concern to system designers, program managers, and system users. Such unexpected behavior can be caused by the failure of components (where failure means breakage), or by modes of operation which were not anticipated during design. This second type of behavior is known as a sneak condition. Whereas component failures do not exist until some point in time, sneak conditions are latent or built-in and can happen at anytime. They may exist in hardware, in software, or in the interaction of the hardware and software. While sneak conditions are not caused by component failure, a sneak condition may result in the failure of components.
Simulation of systems has long been used to predict behavior under certain conditions. The availability of affordable, high-speed computers has made simulation of large, complex systems a standard part of system design. However, there are inherent characteristics of simulation that make the discovery of many types of sneak conditions unlikely.
Predicting the Location of the Needle in the Haystack
Simulations are input-driven, what-if analyses. Determining the sets of input conditions which can cause an unexpected output can be very difficult. Consider the simple two-input "black box" system shown in figure 1.
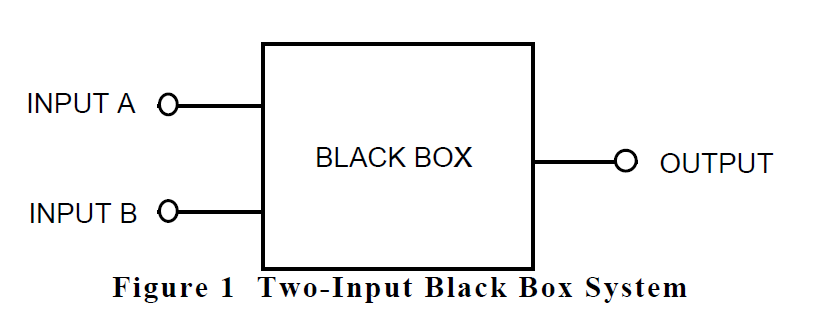
For simplicity, assume that each input can only assume one of two states, high and low. When considering the possible system input combinations, many people may think of the four static states shown in table 1. However, table 2 shows that there are also eight additional dynamic/static combinations. One of these 12 combinations may not behave as expected, or perhaps one of these 12 combinations was never defined because it did not reflect a typical operation. Simulation of all 12 combinations and review of the results are considerable efforts for a system with only two inputs.

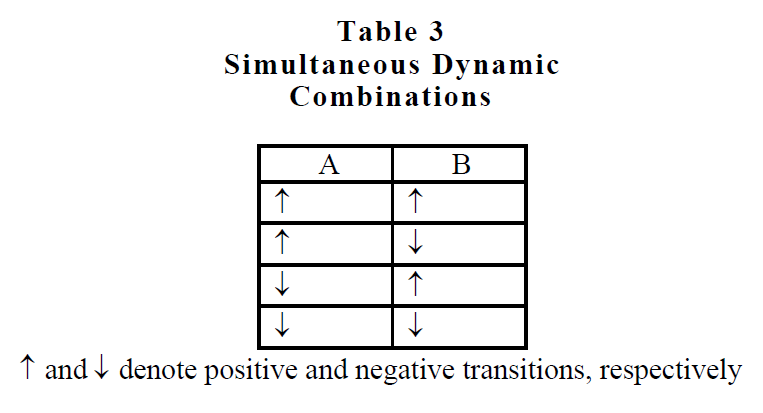
Also consider the situation where both inputs change simultaneously as shown in table 3. This provides another four combinations.
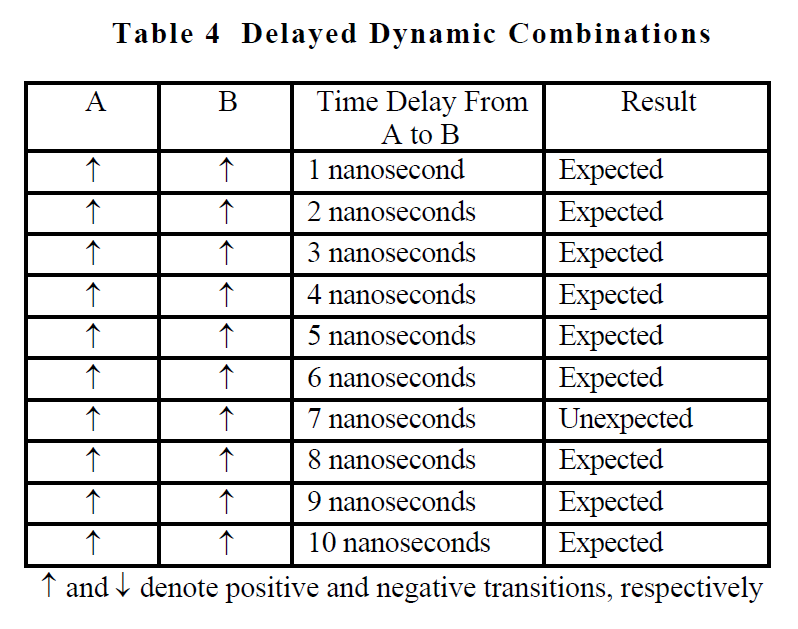
Further consider the case illustrated in table 4 where both inputs change but with a time delay between the transitions. When the delay between the transition of input A to input B is more than 6 nanoseconds but less than 9 nanoseconds, an unexpected output occurs. We haven't even determined the exact range of delay times that will yield the unexpected behavior. Suppose the simulation had tested for
delay times of 10, 20, 30, etc., nanoseconds? Suppose that we had kept our simulation intervals tight at 1 nanosecond, but the problem behavior did not occur until 23,486 nanoseconds of delay from the time that signal A transitions positive until signal B transitions negative? The inclusion of time provides a continuous analog variable and therefore an infinite combination of possibilities to consider, even in this simple example.
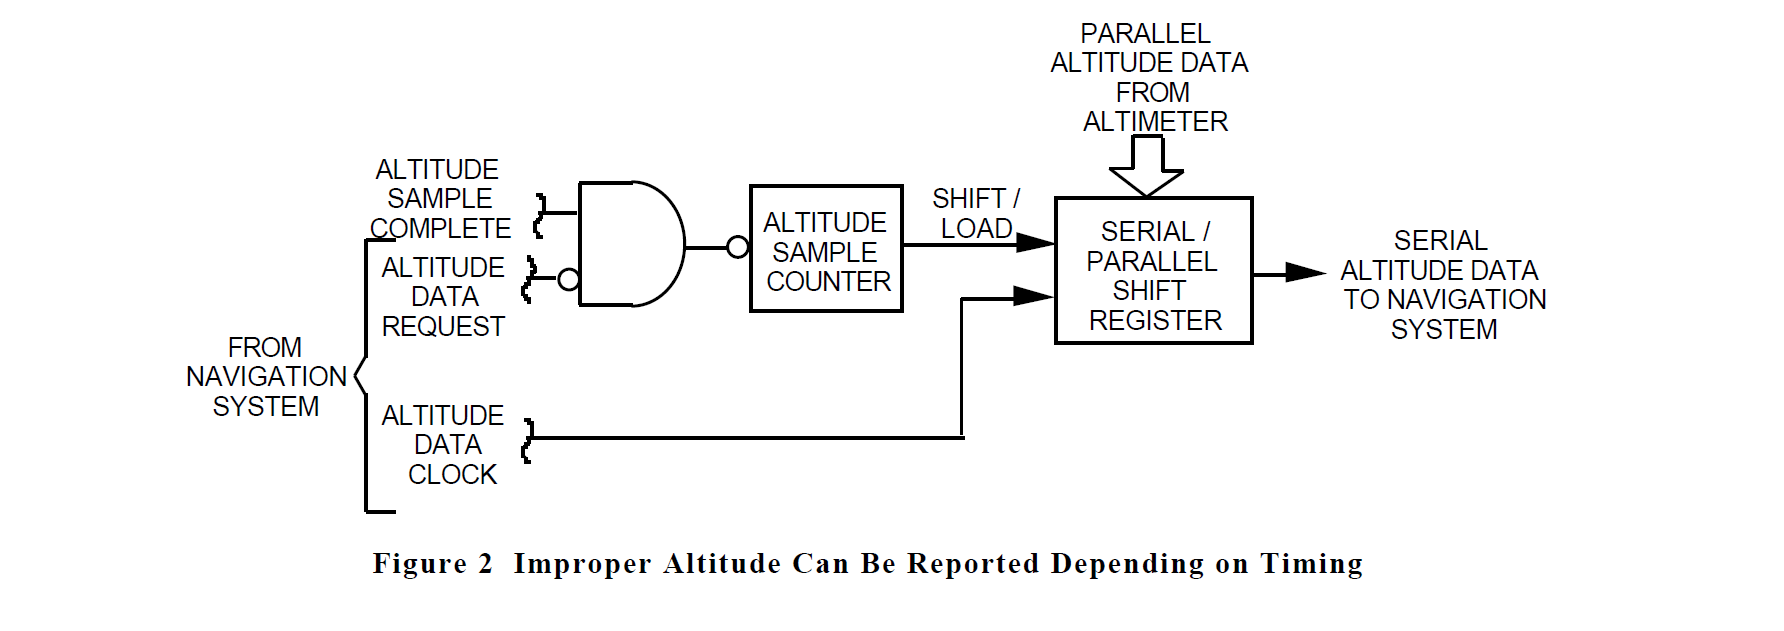
One example of this type of problem which was uncovered by Sneak Analysis existed in a radar altimeter. Simulation had been used throughout the design of the altimeter to make valuable design tradeoff decisions, find problems and check proposed remedies, optimize producibility, and verify operation under various conditions. The altimeter would take 100 samples and average them to assure accuracy. As shown in figure 2, a counter was used to determine when the 100th sample was complete. This set a latch to enable parallel loading into a shift register of 16 bits of data which represented the altitude. When the navigation system required updated altitude data, it would send an altitude data request followed by a string of altitude data clock pulses to serially shift out the altitude data from the shift register. To assure that the completion of a set of samples did not result in dumping new data during the middle of a shift-out of altitude data, the altitude data request signal was used to inhibit the sample counter.
However, if the navigation system sent its request while the 100th sample was being taken, the inhibited sample signal would appear to the counter as if the 100th sample had been completed. This would cause new data to be loaded after two bits of data had been shifted out of the shift register. This resulted in moving all data bits except the two least-significant bits two places to the left. Therefore, a digital output of 0000 0110 0000 000 (representing 2,047 feet) would appear as 0001 1000 0000 0000 (representing 8,191 feet).
This system had undergone extensive simulation and hardware testing, neither of which had revealed this problem. When the Sneak Analysis reported the problem, the initial reply from the design team was that the problem could not exist because it had not shown up in simulations or test. Subsequently, a test was conducted in which the timing was forced to that described by the Sneak Analysis, and the altimeter provided the improper output.
Similarly, simulation of software presents the problem of numerous combinations of paths through the software code coupled with all the possible combinations of the values that the variables can assume.
Sneak Analysis, on the other hand, does not attempt to step through the combinations of inputs that might exist in a system. Instead, Sneak Analysis utilizes a knowledge base known as sneak clues. These clues are applied to a database which contains all connectivity paths (electrical current flow, software program flow, hydraulic flow, data/signal flow through these subsystems, etc.). The database also contains information on component attributes related to the clues. The detail-level graphical representation of the database is known as network trees. The system-level graphical representation is known as forests. Sneak clues are visible attributes on the network trees and forests which point to specific problem types which might exist in the network tree or forest being analyzed.
For example, in the logic shown in figure 3, the signal that originates at point A splits and then travels through two paths, one in software and one in hardware. The result of these operations on signal A rejoins at AND gate #2. Without analysis of the desired operation or consideration of the possible combinations that the three inputs can assume, a general sneak clue can be recognized in the pattern which is highlighted by the arrows in figure 3.
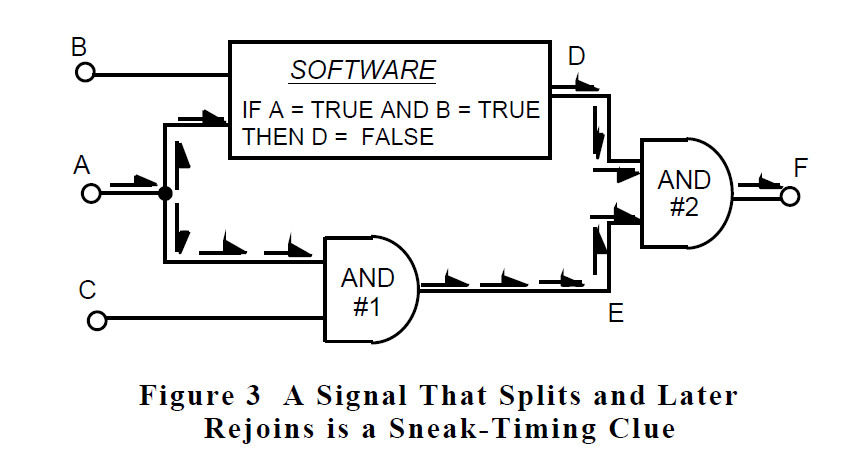
This general clue can be further classified. The sneak clue knowledge base tells us that when this pattern exists and the rejoin occurs at an AND function, a sneak-timing glitch can occur at the output if one path has an odd number of inversions, the other path has an even number of inversions, and the path with the odd number of inversions is the slower of the two. In this example, the software provides one inversion of the signal, and also provides a longer time delay than the other (software is slower than one AND gate in hardware). The sneak clue knowledge base also tells us that the result of this sneak timing condition is a short positive pulse that occurs when input A transitions from a low state to a high state as shown in figure 4.
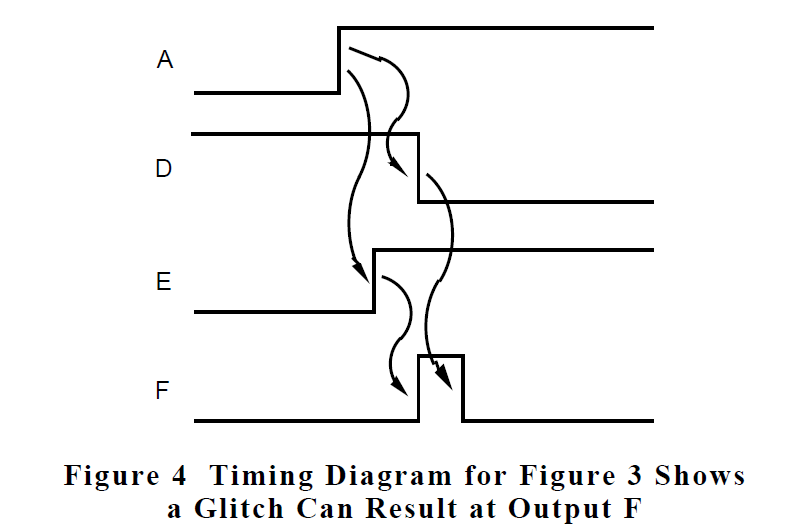
After identification of the potential of the timing glitch, the next step is to determine if the timing glitch, should it occur, has an impact on the system. If, in the example, output F controls a light bulb, then it is unlikely that it would be noticed. However, if output F is connected to the clock input on a counter, then an extra count of the counter would be recorded.
After determining that there is a potential impact to the system, the next step is to ascertain whether the combination of conditions necessary to cause the sneak condition is prevented. In figure 3, it is easily determined that for the sneak paths to be enabled, both inputs B and C must be in their high (true) states at the time that input A transitions from a low to a high state. The origins of inputs B and C will be shown on the network trees and forests. If the trees and forests show that there are no common elements in the paths that contribute to signals B and C, then there is nothing to prevent both of these signals from being in the high state at the same time. In a like manner, the trees and forests would be checked for common elements between inputs A and B. If there are no common elements, then there is nothing to prevent the sneak condition from occurring and it is, therefore, possible. If there are common elements, then they must be examined further to determine if the sneak condition can occur.
At this point, it may be useful to employ simulation to verify that the deduced input combinations for the sneak condition will result in the suspected problem. Also, simulation can provide the values of timing parameters involved and a measure of how they may change dependent on circuit components or software parameters.
Hidden Inputs
A system's data flow is mapped initially in blockdiagram form, perhaps without regard to whether parts of it will be implemented in software or hardware, or which particular integrated circuit families might be used. As portions of the design are firmed up iHnto hardware, power and ground connections to the physical devices must be added. The effects of system power-up are usually considered; however, the effects of power-down, especially partial or unorderly power-down may not be fully considered. Also, these necessary power connections may act as additional, unintended logic inputs as in the power supply voltage monitor of figure 5.
If the System "A" 5-volt supply fails suddenly to a value below that required to operate the AND gate, the POWER SUPPLY GOOD output from the AND gate will be
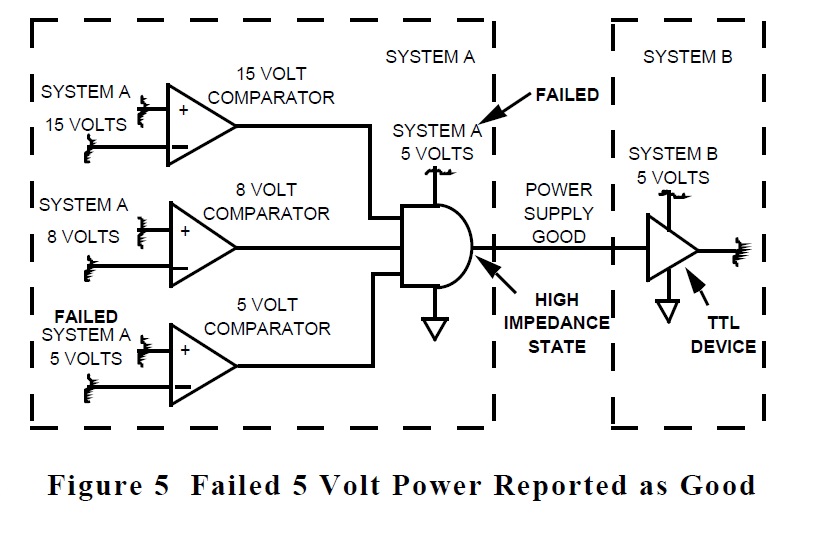
an open circuit. However, if the receiving device in system B is of the transistor-transistor logic (TTL) family, it will interpret the open circuit as a logic high level and report that the power supply is totally operational.
Details, Details
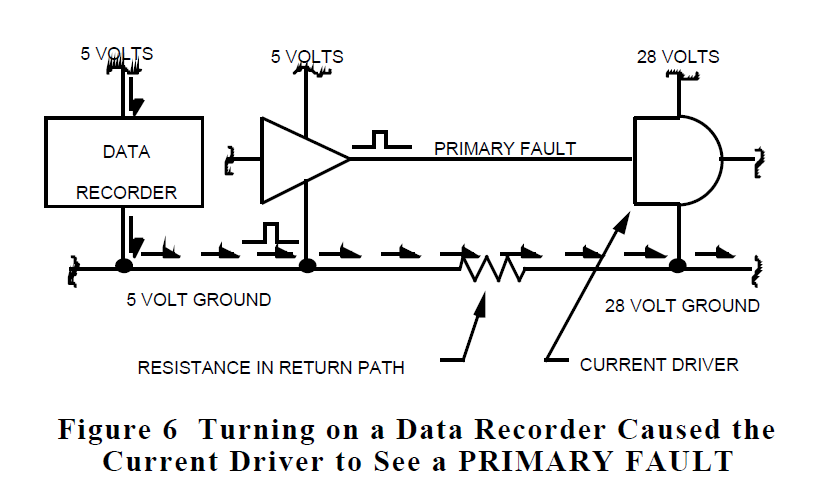
Details of the design implementation, often not accounted for in simulation models, can cause sneak conditions. For example, a redundant control system used current driver integrated circuits powered by 28 volts. It is customary to provide a return path for 28-volt devices through 28-volt ground as was done in this control system and as illustrated in figure 6.
No problem was revealed by simulation or testing. When a government-furnished data recorder was installed into the system for flight, every time the tape recorder was turned on, the system would report a failure of the primary control system. However, Sneak Analysis revealed that the only 28 volt path through the current driver integrated circuit was through the output. The ground pin on the current driver is used internal to the current driver as a reference for the 5 volt input signal. Each time the recorder was turned on, a large filter capacitor across its input acted as a temporary short circuit. The resulting current spike momentarily raised the potential of the 5-volt return, and thus the level of the PRIMARY FAULT signal. The current driver, having its return referenced to 28-volt ground, interpreted this voltage shift as an actual PRIMARY FAULT signal. Changing the connection of the current driver ground pin to the 5-volt return corrected the problem behavior.
Software instructions can also contain surprising modes of operation which only appear under unusual conditions. The
ways in which certain instructions are compiled and the way numbers are modeled and manipulated in software can produce unexpected results not accounted for in the system design.
Causes of Sneak Conditions
Sneak conditions have been found to be caused by three main factors. These are called the spaghetti factor, the tunnel vision factor, and the human factor. The spaghetti factor, as its name implies, deals with the entanglement of multiple functional and electrical paths. This occurs both in a system design and in the data which represent the system.
Contributors to the spaghetti factor include the size and complexity of modern systems and the layout of data. The numerous inputs and outputs which are cross-fed resemble a bowl of spaghetti. Most of the data which represent a system are organized for manufacturing purposes. These data with their many crossed signal lines can hamper complete understanding of all the ways in which the system may behave. The modeling of the design for simulation is sometimes adversely affected by the spaghetti factor. Also, some sneak related behaviors of components are not included in simulation models because they are not known to the modelers or are considered too weird to worry about. Most designs are usually complex enough so there are many inputs and outputs. Most of the inputs affect multiple outputs. These inputs and outputs interface to circuitry on other assemblies. All of these elements contribute to the spaghetti factor.
The tunnel vision factor deals with the splitting of the design and the system documentation into pieces. Most systems are split up among multiple contractors. Each contractor may split the design into various departments. Technology specialists, such as digital designers, analog designers, software engineers, power supply designers, and application specific integrated circuit (ASIC) designers add to the division by speaking different languages, when they speak to each other at all. This division causes data segregation so complete, detailed operation of even a single function is like traveling a maze. Further, changes to the original design complicate matters and have proven to be a source for introducing sneak conditions into previously clean functions. Because limited budgets are always a problem, there is a desire not to replicate what the designer of the interfacing equipment or software is doing; therefore, the "big picture" is sometimes not seen. Relationships between various parts of the design are sometimes not seen until integration into topological network trees and forests and, therefore, are sometimes not included in simulations.
The ASIC design function is usually segregated from the remainder of the system design effort and is performed by specialists. Often, ASIC design is subcontracted, and in addition, involvement of the ASIC vendor occurs to varying degrees. ASIC design uses somewhat different design tools than those used for circuit cards. The schematics and netlists for ASICs look different from those for circuit boards. The specifications for ASICs which we have seen in our analyses are more vague and incomplete than those for other circuitry. These items contribute to the tunnel vision factor which is greater for ASICs than for board design.
The third contributing factor to sneak conditions, the human factor, involves people in the design and operation of a system. In design, two people working from a specification may interpret that specification in different ways. This can result in an incompatible design interface. The nature of these differences of interpretation often result in designs that work in the lab and even most of the time in the field. However, they cause occasional and sometimes very serious results for which an explanation is difficult to find. The human operator of a system can also be a contributor to the occurrence of a sneak condition. Operators are faced with ambiguous procedures, controls which do not do exactly what their labels indicate, and system indicators which may not provide the actual system status. They may have to make split-second decisions in panic situations. Such situations are likely to prove an axiom of Murphy's law which states: "The likelihood of a sneak condition occurring is proportional to its criticality to safety or the rank of the visitor who is watching the demonstration."
the Uniqueness of the Sneak Analysis Approach
Rather than assuming any particular scenario of input conditions, Sneak Analysis utilizes the application of clues to topological network trees and forests. The use of network trees and forests reduces the spaghetti factor by separating functions into individual network trees and forests. It reduces tunnel vision by combining piecemeal functions from various data sources and physical locations into a single network tree and combining hardware and software subfunctions into system functions on forests. It also allows evaluation of human factors. While Sneak Analysis is not well suited to running "what if" scenarios, clue application is not limited to specified procedures or mission profiles as are simulation and testing. Therefore, simulation and testing may not reveal sneak conditions.
Whenever possible, computer-formatted data such as hardware netlists and software program code furnished on magnetic media are directly loaded into the system. Computer processing combines these data together along with a library which provides details of integrated circuits and software language operation. The tracing of both electrical and functional paths by the Sneak Analysis programs results in topological network trees and forests.
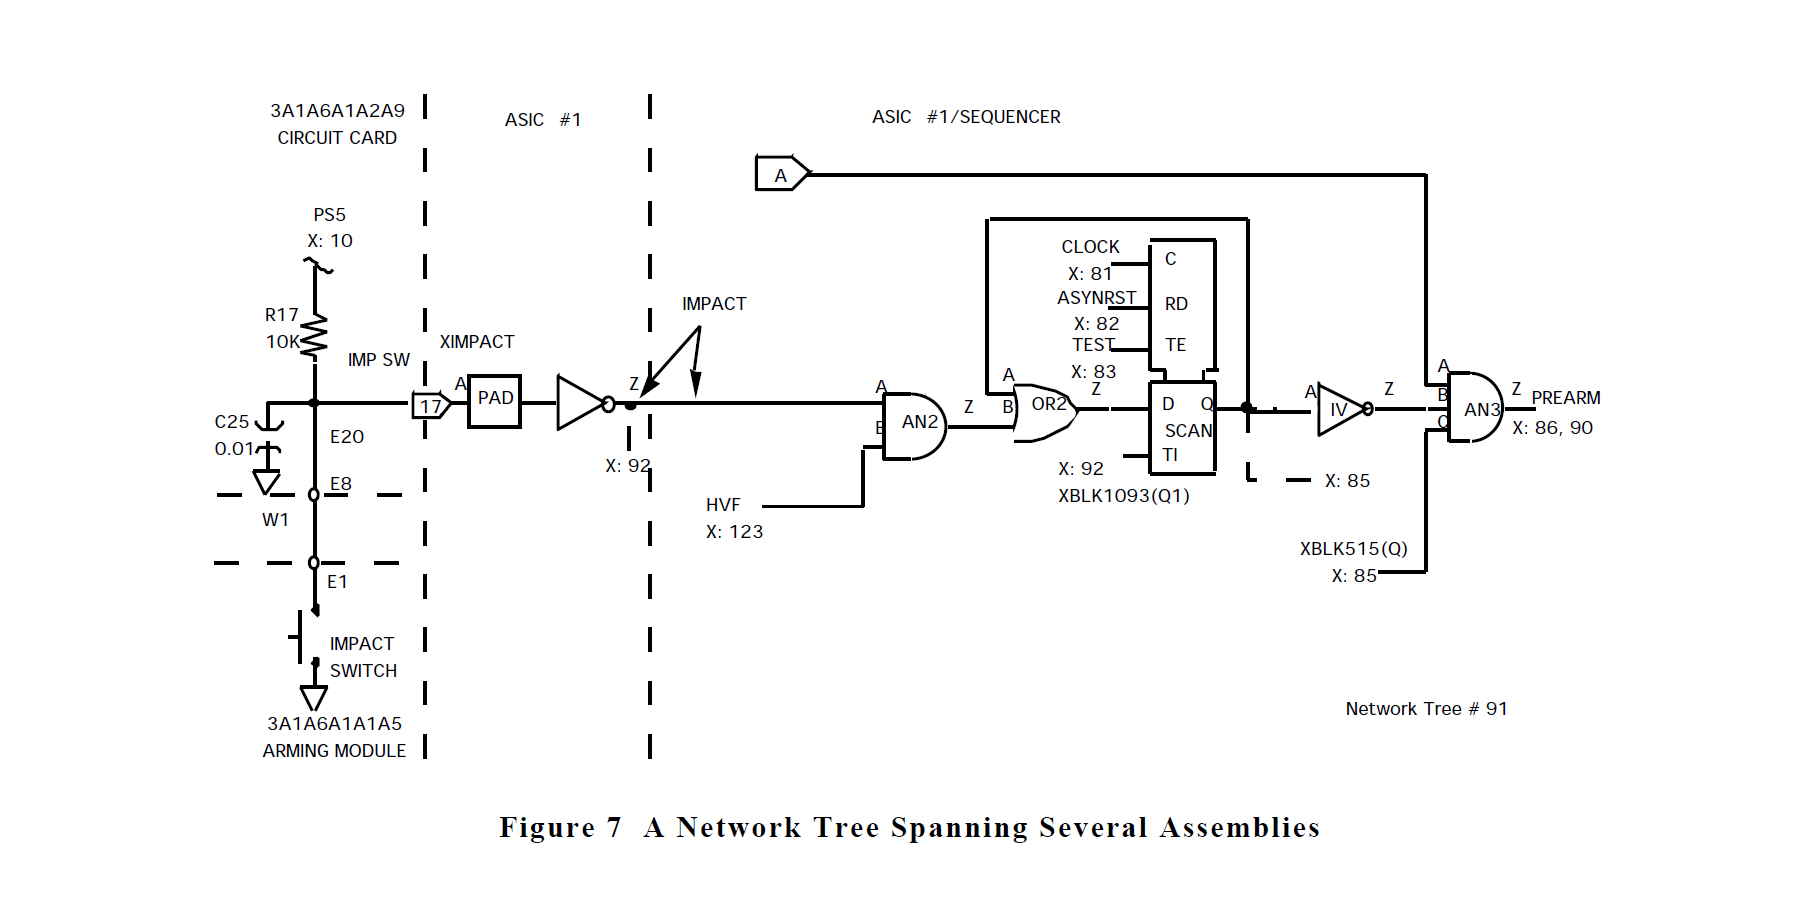
The network trees show individual functions which may cross through multiple physical boundaries such as circuit cards, boxes, or cables. A sample network tree which contains circuitry from an ASIC is shown in figure 7. Note that this network tree also integrates circuitry contained on the circuit board, a cable, and an external module.
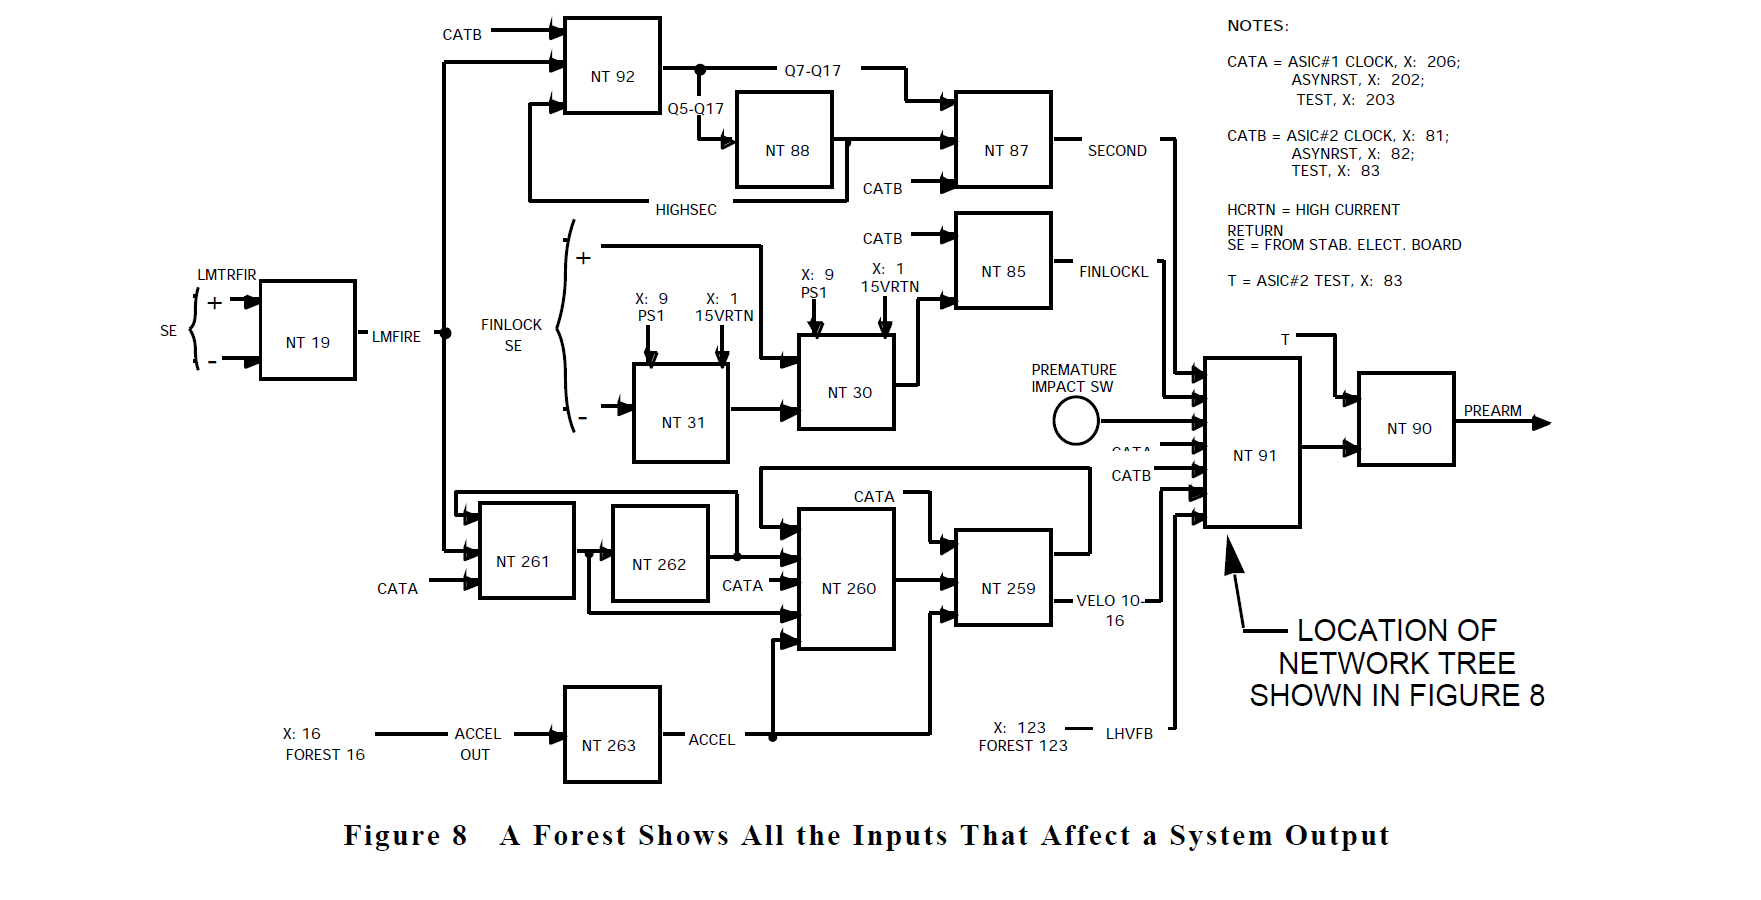
Forests show how the network trees relate to one another and provide a system-level view of a particular system output function. A forest will show all inputs which can affect the forest output. A sample forest is shown in figure 8 which contains the network tree from figure 7.
Results of Analyses
Three recent Sneak Analyses of systems resulted in the identification of 91 conditions of possible unexpected behavior which had not been uncovered by extensive simulation and testing. Most of these conditions resulted in changes to the hardware design or software code and several were considered safety critical. Simulation was used to verify the problems once they were uncovered by the Sneak Analysis, and to better understand the impact of some of the reported conditions. The investigation of various proposed fixes for the problems also employed simulation.
The problems uncovered by the Sneak Analysis in these systems were found prior to production hardware being built. In one case, a safety critical sneak condition involving an ASIC was found and reported one week before mass production of the ASIC chip was scheduled. For each of these analyses, the customer stated that the identification of even just one of the sneak conditions more than paid for the cost of the analysis.
Other Benefits
The network trees and forests produced for the Sneak Analysis are often used to perform Fault Tree Analysis and Failure Modes, Effects, and Criticality Analysis. The network trees and forests provided a clear and accurate representation of the paths through the system for tracing failure effects. During the analyses, numerous design changes occurred which were incorporated into the network trees and forests. Some of these changes resulted in additional sneak conditions which were found and reported before the change was applied to actual hardware.
Biography
James L. Vogas
Boieng Aerospace Operations, Inc.
P.O. Box 58747
Houston, Texas 77258
Jim Vogas is a Principal Engineer in the Sneak Analysis group. He has responsibility for Sneak Analysis product improvement and is responsible for training of sneak analysts in the latest Sneak Analysis methodology as well as avionics and technology areas. He has over 17 years experience performing and leading Sneak Analysis, Failure Modes and Effects Analysis, and Fault Tree Analysis projects. His Sneak Analysis experience includes military and commercial aircraft, missiles, spacecraft, and advanced weapon systems. He is also involved in the improvement of Sneak Analysis techniques and is working on design of improved automation. He has recently developed computerized sneak clue lists for the Ada and Modula software languages. He holds a B. S. in electrical engineering from Texas A&M University.
